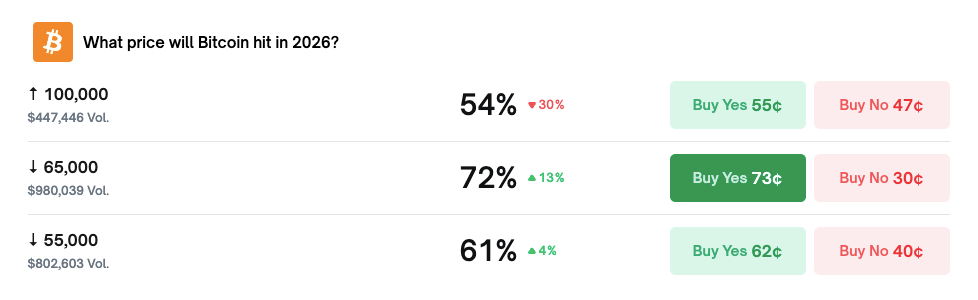
The weekend sell-off caused Bitcoin’s price to briefly dip below the psychological level of $75,000, and market sentiment seems to have shifted overnight. On the prediction platform Polymarket, a compelling wager is heating up: the probability of Bitcoin falling below $65,000 by 2026 has surged to 72%, attracting nearly $1 million in bets. This is not just a numbers game; it acts as a mirror reflecting the turbulent currents deep within the crypto market—from the exuberance after Trump’s election victory to the current widespread anxiety over “deep dips,” with the speed of change astonishing.
What’s more, some veteran players are alarmed that this decline has caused the world’s largest Bitcoin-holding publicly traded company, Strategy, to face its first test since late 2023—its average holding cost being breached. It’s like a marathon leader suddenly finding the track beneath them turning slippery.
Why has market sentiment plummeted so rapidly?
On the surface, it appears to be a price correction. But upon closer inspection, several forces are twisting together, pulling the market in different directions.
First, there are technical “breakdown” signals. According to some on-chain analysis firms, Bitcoin has been in a “bear market” cycle since falling below its 365-day moving average in November 2025. This long-term moving average is often seen as the “bull-bear dividing line”; once lost, it typically triggers systematic de-risking among technical investors. I recall during the 2018 bear market, similar long-cycle moving average breaches led to months of downward drift and bottoming processes, with early bottom-fishing being akin to “walking into a firing squad.”
Second, the macro liquidity “valve” seems to be tightening. Some macro analysts point out that the current correction is more due to liquidity tightening in the overall U.S. financial environment rather than any fundamental flaw in cryptocurrencies themselves. Changes in the Federal Reserve’s balance sheet, the draining effect of Treasury issuance—these seemingly distant macro factors are actually transmitted through risk asset pricing logic directly into Bitcoin’s price. When the tide (liquidity) recedes, the most volatile assets are the first to be exposed.
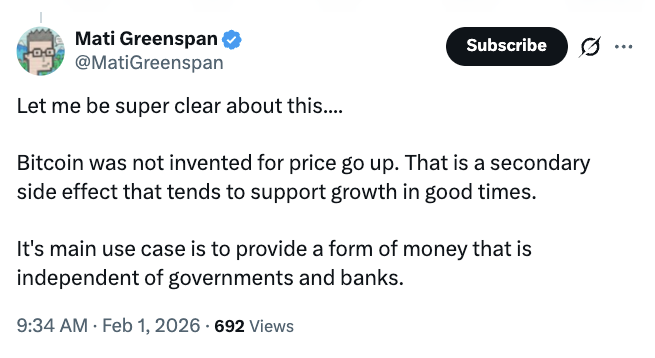
Lastly, an interesting perspective comes from industry insiders. Mati Greenspan, CEO of Quantum Economics, reminds us that perhaps we’ve been focusing on the wrong thing all along. He wrote on social media that Bitcoin’s core design goal is to be a currency independent of the traditional banking system; price appreciation is merely a potential “side effect,” not its primary purpose. This viewpoint is like a cold shower, prompting us to think: when the market only focuses on price swings, has it already strayed from its original vision?
 Are prediction markets’ “crystal balls” accurate?
The high-probability bets on Polymarket undoubtedly amplify the market’s bearish expectations. Besides the chance of falling below $65,000, bets on Bitcoin dropping to $55,000 have reached 61%. Meanwhile, there’s still a 54% chance that it will return to $100,000 before the end of the year. This tug-of-war between bulls and bears highlights the significant divergence in market views.
Are prediction markets’ “crystal balls” accurate?
The high-probability bets on Polymarket undoubtedly amplify the market’s bearish expectations. Besides the chance of falling below $65,000, bets on Bitcoin dropping to $55,000 have reached 61%. Meanwhile, there’s still a 54% chance that it will return to $100,000 before the end of the year. This tug-of-war between bulls and bears highlights the significant divergence in market views.
But here’s a key question: do the probabilities in prediction markets equal future “facts”? Not necessarily. They more accurately reflect the collective sentiment of current market participants voting with real money. This sentiment is highly contagious, capable of self-fulfillment, but it can also reverse instantly due to a sudden positive catalyst. Just like the epic bull run that followed the March 2020 crash—no one predicted the subsequent surge. Prediction markets are excellent windows into market mood, but they are not navigation charts for investing.
Additionally, Polymarket itself faces regulatory challenges, such as restrictions in Nevada due to licensing issues. This reminds us that this “sentiment barometer” is also in a dynamic environment.
Institutional opinions clash—who should retail investors listen to?
In the face of market confusion, the views of large institutions are also in a fascinating “battle.”
On one hand, bearish sentiment dominates prediction markets and some analysts. On the other, just a few months ago, several top firms issued quite optimistic forecasts. For example, Grayscale Investments predicted Bitcoin could break its all-time high of $126,000 in the first half of 2026, citing ongoing institutional adoption and gradually clarifying regulation. Analysts from Standard Chartered and Bernstein also set target prices of $150,000 for 2026, though they later lowered expectations due to slowing ETF inflows.
 This contradiction is not uncommon. The long-term logic of institutions—such as Bitcoin’s scarcity and the narrative of digital gold—often speaks a different language from short-term market fluctuations driven by liquidity, sentiment, and technical factors. For investors, the key is to discern which voice you’re hearing: is it a multi-year trend judgment or a warning about risks in the coming quarters?
What should investors focus on now?
Market noise is abundant, but I believe we can concentrate on a few more tangible indicators rather than being led solely by price movement probabilities.
- Strategy’s “cost line” defense: As a market “flag,” the relationship between its stock price and its average holding cost is worth watching. If Bitcoin remains below its average cost, will it shake long-term holding strategies or influence other listed companies’ attitudes? This is an important directional indicator.
- Real macro liquidity data: Instead of guessing, pay attention to actual data like the Federal Reserve’s balance sheet and the U.S. Treasury General Account (TGA) balance. These are the “driving forces” behind all risk assets, including cryptocurrencies.
- On-chain activity’s “quality” and “quantity”: When prices fall, is it long-term holders panic selling, or over-accumulation? On-chain data can reveal whether holdings are dispersed or concentrated. For example, changes in long-term holder supply, exchange inflows and outflows—these often provide more forward-looking signals than price charts.
- Your own investment logic: This is the most crucial point. Why did you invest in Bitcoin in the first place? Because you believe in its potential as a store of value long-term, or just for short-term speculation? If your long-term reasoning remains unchanged (such as global money supply expansion or sovereign credit risks), then market volatility can serve as a test of your conviction and an opportunity for better entry points. If you’re just riding the wave, then any fluctuation can make you restless.
Markets always swing between excessive optimism and excessive pessimism. When 72% of people on Polymarket bet on a decline, it might be the moment for us to stay calm and think contrarily. After all, in the crypto world, consensus is often very costly, and true opportunities often arise when consensus breaks down. Of course, any judgment should be aligned with your own situation—markets are inherently uncertain, and proper position management and risk control are essential skills to navigate any cycle.
Disclaimer: The information on this page may come from third parties and does not represent the views or opinions of Gate. The content displayed on this page is for reference only and does not constitute any financial, investment, or legal advice. Gate does not guarantee the accuracy or completeness of the information and shall not be liable for any losses arising from the use of this information. Virtual asset investments carry high risks and are subject to significant price volatility. You may lose all of your invested principal. Please fully understand the relevant risks and make prudent decisions based on your own financial situation and risk tolerance. For details, please refer to
Disclaimer.
Related Articles
Dogecoin Sees Rising Long Bets While Price Stays Under Pressure
Dogecoin's long positioning increases as traders expect a rebound, yet significant short positions and declining trading volume suppress price movement. The market lacks direction, showing a sideways to slightly bearish outlook as the price struggles to gain momentum.
CryptoNewsLand34m ago
Dogecoin Eyes Breakout as Bollinger Bands Signal Price Shift
Key Insights:
Dogecoin trades near resistance as Bollinger Bands tighten, signaling reduced volatility and an increasing likelihood of a sharp directional price movement soon.
Declining trading volume reflects market hesitation, yet reduced selling pressure may still support upward
CryptoNewsLand39m ago
PEPE Price Holds Bearish Structure as Rebound Signal Emerges
Key Insights
PEPE remains in a clear downtrend, with persistent lower highs and continued selling pressure keeping the price near key support levels around $0.00000330.
The TD Sequential indicator signals a possible rebound after an extended decline, suggesting a move toward 0.0000050 if
CryptoNewsLand1h ago
Cardano Holds Key Support as Whale Activity Signals Shift
Key Insights:
Whale accumulation increased steadily since March, with large holders absorbing supply near lows while retail activity remained subdued during weak price action phases.
Stablecoin liquidity on Cardano doubled year over year, strengthening market depth and supporting stronger
CryptoNewsLand1h ago
Chainlink Price Holds Steady as $9.75 Resistance Draws Focus
Key Insights
Chainlink trades within a defined range as a neutral RSI and steady volume create conditions for a potential breakout once momentum strengthens in the coming sessions.
Resistance at $8.89 remains critical as a confirmed move above this level could push the price toward the
CryptoNewsLand1h ago
ETH 15-minute pullback of 1.00%: Large capital selling and leveraged derivatives amplify short-term volatility
2026-04-06 16:45 to 2026-04-06 17:00 (UTC), ETH saw a brief 1.00% drop within 15 minutes; the price fell from 2168.6 USDT to 2140.3 USDT, with a swing of 1.31%. This round of abnormal price movement has drawn market attention, with heightened short-term volatility and a corresponding increase in trading volume.
The main driver behind this move is on-chain data showing that large ETH transfers of more than $10M per transaction were concentrated into a certain major exchange; the related net inflow of funds reached as high as 6,617.12 ETH. After the funds arrived,
GateNews2h ago
