Cardano (ADA) enters the early days of the new year with a positive outlook, continuing to maintain a stable upward momentum and trading around the $0.36 mark at the time of writing on Friday. On-chain indicators along with developments in the derivatives market show a clear improvement, reflecting increasing buying pressure and growing investor interest. In this context, technical signals continue to lean towards a positive scenario, with a focus on the potential formation of a breakout trend in the near future.
On-chain and Derivatives Data of Cardano Indicate an Uptrend
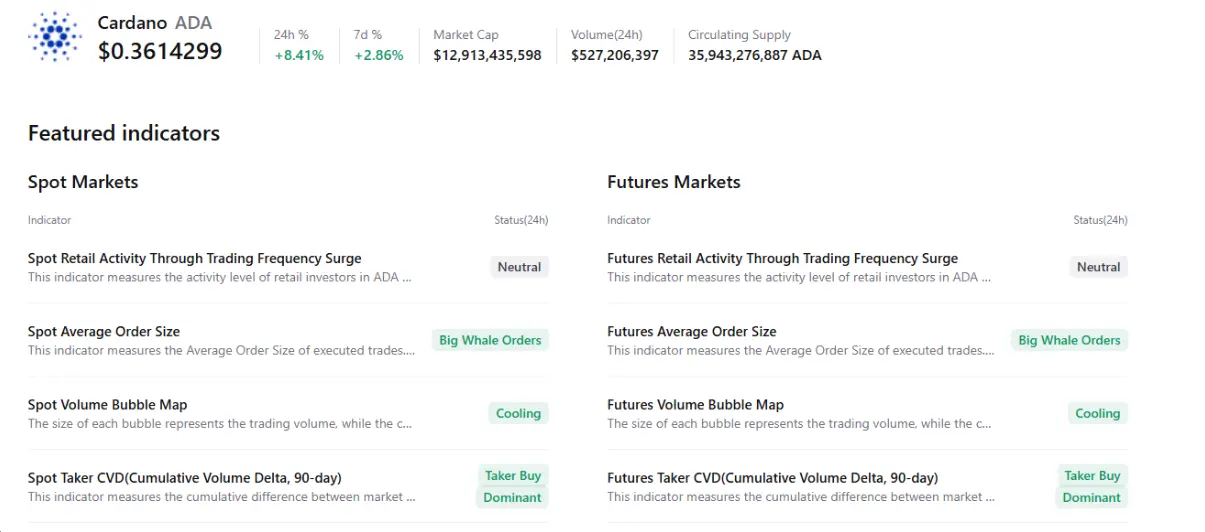
Aggregated data from CryptoQuant paints an optimistic picture for Cardano. Both the spot market and futures contracts show large buy orders from “whales,” amid cooling market conditions and a clear dominance of buying pressure. These signals suggest trader sentiment is significantly improving, raising expectations for a potential bullish breakout in the coming days.
 Source: CryptoQuant Not only that, but Cardano’s funding rate data also reinforce the positive outlook. According to the OI-Weighted Funding Rate index from Coinglass, the number of traders betting on an upward trend currently outweighs those expecting continued weakness in price.
Notably, the funding rate has turned positive since Thursday and reached 0.0068% on Friday, reflecting that the (Long) side is willing to pay fees to the (Short) side. Historically, as shown on the chart, whenever the funding rate shifts from negative to positive, Cardano’s price has often experienced strong upward movements.
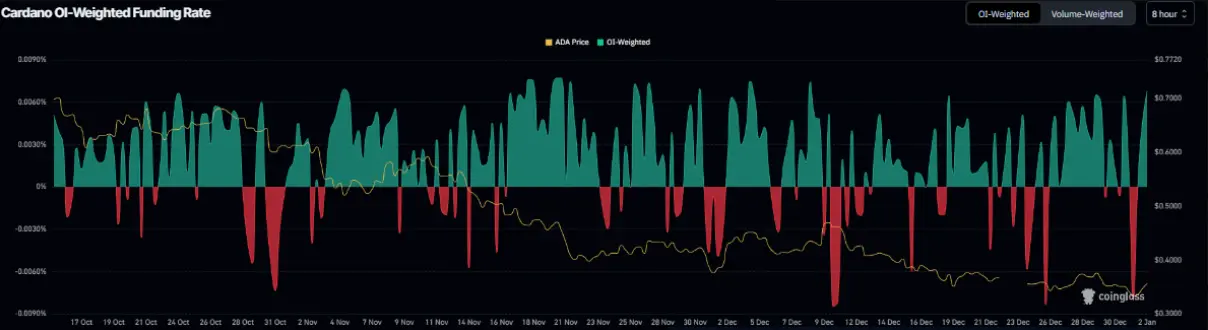 Cardano Funding Rate Chart | Source: Coinglass## Cardano Price Forecast: New Year Brings Optimism as ADA Approaches Breakout of Descending Wedge Pattern
The price of Cardano (ADA) faced strong resistance at the upper trendline of the descending wedge pattern — formed from mid-October by connecting the peaks and troughs with two converging trendlines. After being rejected at this level on Monday, ADA plunged nearly 10% by Wednesday. However, the market quickly saw a significant rebound: the price recovered 6.9% on Thursday and by Friday had approached the critical resistance trendline again.
In a positive scenario, if ADA decisively breaks out of the descending wedge pattern, the recovery momentum is likely to extend toward the nearest resistance zone around $0.42 — coinciding with the 50-day exponential moving average (EMA), which holds notable technical significance.
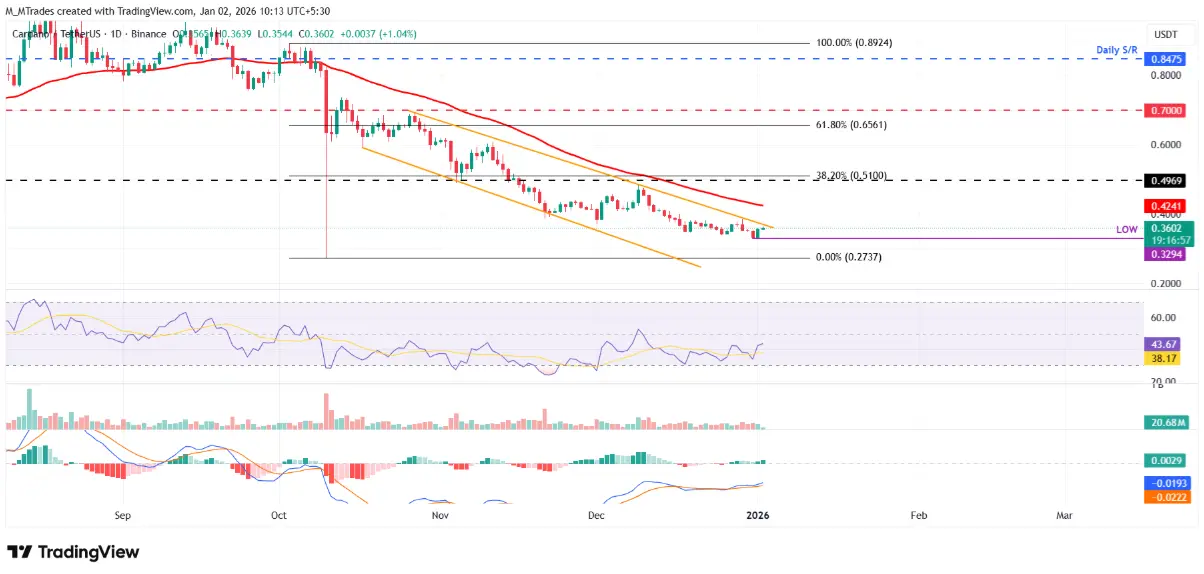 Daily ADA/USDT Chart | Source: TradingView Momentum indicators are also signaling improvement. The RSI on the daily timeframe is currently at 43 and trending upward toward the neutral zone at 50, indicating selling pressure is gradually weakening. For the bullish trend to become more sustainable, RSI needs to break above and hold above 50. Meanwhile, the MACD indicator has formed a bullish crossover and remains maintained, further supporting the view that the market is leaning slightly towards a recovery scenario.
However, the risk of correction still exists. If ADA fails to break out and reverses downward, the price could continue to test the support zone established on Wednesday, around the $0.32 level.
Disclaimer: The information on this page may come from third parties and does not represent the views or opinions of Gate. The content displayed on this page is for reference only and does not constitute any financial, investment, or legal advice. Gate does not guarantee the accuracy or completeness of the information and shall not be liable for any losses arising from the use of this information. Virtual asset investments carry high risks and are subject to significant price volatility. You may lose all of your invested principal. Please fully understand the relevant risks and make prudent decisions based on your own financial situation and risk tolerance. For details, please refer to
Disclaimer.
Related Articles
River (RIVER) Price Keeps Pumping as TD Indicator Signals Another Rally
Analyst Ali Martinez highlights the accuracy of the TD Sequential indicator in predicting River (RIVER) price movements. The indicator has consistently identified significant buy and sell signals throughout RIVER's volatility, suggesting potential future trends based on current signals.
CaptainAltcoin52m ago
ETH 15-minute decline of 0.88%: Capital outflow dominates market, intensifying short-term selling pressure
On March 22, 2026, from 21:00 to 21:15 (UTC), Ethereum (ETH) recorded a -0.88% return rate within 15 minutes, with the price fluctuating in the range of 2029.54 to 2060.75 USDT, reaching an amplitude of 1.52%. Market attention has increased, short-term volatility has significantly intensified, reflecting rapid conversion of funding pressure into price pressure.
The main driver of this anomaly is accelerated capital outflows from trading platforms: approximately 420,690 USD equivalent of ETH flowed in within 10 minutes, but the number of withdrawals reached 2,319 transactions in the past 1 hour, far exceeding deposits during the same period by 5
GateNews2h ago
BTC Drops 0.58% in 15 Minutes: Tight Liquidity and Institutional Hedging Create Downward Pressure
2026-03-22 21:00 to 21:15 (UTC), BTC recorded a -0.58% return within just 15 minutes, with prices fluctuating in the range of 67562.1 to 68223.5 USDT, with an amplitude of 0.97%. During this period, market sentiment was highly tense, overall attention increased, and short-term volatility accelerated noticeably.
The main driving force behind this anomaly was the resonance formed by spot market liquidity shortage and medium-sized funds accelerating their exit. On-chain data shows a significant net outflow of -371.99 BTC in the $100k-$1M transaction range, driving selling
GateNews2h ago
Risk-Off Drips throughout Markets
Geopolitical tensions and rising uncertainty have led to a risk-off sentiment in global markets, with investors moving away from assets like Bitcoin and Ethereum. High oil prices and inflation concerns influenced portfolio adjustments, while Bitcoin selling pressure increased as short-term holders took profits. The market remains sensitive amid low sentiment.
CryptoBreaking2h ago
Bitcoin Has Stabilized, But Investors Are Paying Up for Downside Protection: VanEck
Bitcoin's volatility has decreased to around $70,000, but traders are still heavily investing in downside protection. Although premiums for puts have dropped, they remain high historically, suggesting caution among investors. This defensiveness may signal an impending price bottom, as similar market conditions in the past have led to recoveries.
Decrypt2h ago
