 Hedera (HBAR) starts January 2026 in a quiet phase. The network ended December with some positive institutional signals, but price action has not followed through yet. The HBAR price is trading near $0.1078 after a steady decline that began back in October.
There is no panic in the chart, but there is also no clear strength. For now, HBAR is moving sideways, and the market is waiting for direction.
The Hedera price has been trending lower for several months, and December did little to change that picture. Instead of sharp sell-offs, price action slowed into a grind, which often signals that sellers are losing momentum.
At the same time, Canary Capital’s spot HBAR ETF continues to add exposure. The fund now holds roughly 1.1% of the circulating supply, showing steady but cautious institutional interest.
Hedera has also been mentioned as a potential 2026 altseason candidate due to its enterprise focus and network design. So far, fundamentals are holding up better than price.
Hedera (HBAR) starts January 2026 in a quiet phase. The network ended December with some positive institutional signals, but price action has not followed through yet. The HBAR price is trading near $0.1078 after a steady decline that began back in October.
There is no panic in the chart, but there is also no clear strength. For now, HBAR is moving sideways, and the market is waiting for direction.
The Hedera price has been trending lower for several months, and December did little to change that picture. Instead of sharp sell-offs, price action slowed into a grind, which often signals that sellers are losing momentum.
At the same time, Canary Capital’s spot HBAR ETF continues to add exposure. The fund now holds roughly 1.1% of the circulating supply, showing steady but cautious institutional interest.
Hedera has also been mentioned as a potential 2026 altseason candidate due to its enterprise focus and network design. So far, fundamentals are holding up better than price.
- What the Hedera Chart Is Showing
- What Market Indicators Are Saying
- HBAR Price Short-Term Outlook for January 2026
What the Hedera Chart Is Showing
Looking at the 4h chart, the trend is still pointing lower. Lower highs and lower lows have remained intact since the October breakdown, and every recovery attempt has been capped quickly.
The Hedera price is now hovering around the $0.105–$0.108 area. This zone has acted as short-term support through the second half of December. Each dip into this range has attracted buyers, but not enough to spark a strong bounce.
The sharp sell-off in October was followed by a slow and controlled decline, not another capitulation. That usually points to exhaustion rather than fear. Still, the structure has not shifted.
For the chart to improve, the HBAR price would need to reclaim the $0.120–$0.125 range and stay above it. Until that happens, the broader trend remains weak.
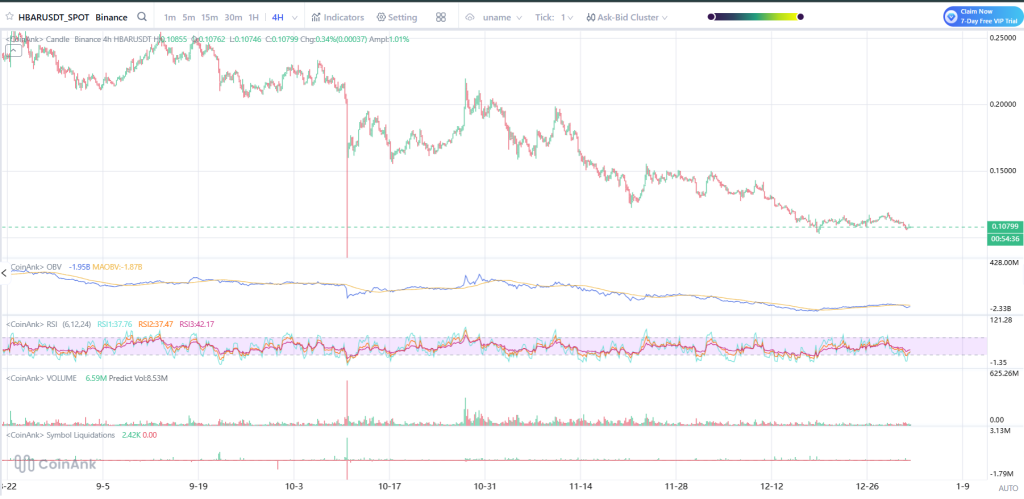
Source: Coinank
What Market Indicators Are Saying
The momentum indicators are still showing a level of indecision. The RSI indicator remains in the mid-high thirties. It is not extremely over-sold, but it certainly does not indicate a level of buying divergence.
OBV has been declining for months, making it certain that volume was supporting sellers. The latest development, however, is that OBV has leveled off, which indicates that selling is slowing, even though accumulation has not yet started.
Trading volume remains light, and liquidation activity is low. That usually means leverage has been washed out and the market is calmer, but also less committed. Overall, indicators point to stabilization, not a trend reversal.
_Read Also: _****The Biggest Mistake XRP Haters Keep Making About Ripple’s Business Model
HBAR Price Short-Term Outlook for January 2026
HBAR will most likely remain range-bound until January unless there is a change in market sentiment or a catalyst.
While, as long as the Hedera price stays above the $0.105 level, there is no threat of further downside. A clear break below that level will again bring the $0.095 to $0.100 level into focus.
On the bright side, a break above $0.115 would be the first sign that indeed buyers are getting in. A breach above $0.120 may pave the way for a general recovery; however, this will be facilitated by greater volumes.c
For now, the HBAR price looks like it is building a base. The network continues to develop in the background, but price still needs confirmation before January can turn convincingly bullish.
Disclaimer: The information on this page may come from third parties and does not represent the views or opinions of Gate. The content displayed on this page is for reference only and does not constitute any financial, investment, or legal advice. Gate does not guarantee the accuracy or completeness of the information and shall not be liable for any losses arising from the use of this information. Virtual asset investments carry high risks and are subject to significant price volatility. You may lose all of your invested principal. Please fully understand the relevant risks and make prudent decisions based on your own financial situation and risk tolerance. For details, please refer to
Disclaimer.
Related Articles
Michael Saylor “Laser Eyes” post surpasses 1 million views, billionaires follow up by buying crypto
MicroStrategy Executive Chairman Saylor has restarted the laser eyes symbol, expressing his bullish conviction in Bitcoin, and contrasting it with the current market’s fear sentiment. MicroStrategy holds 761,068 Bitcoins and plans to increase that to 1,000,000 by 2026. Real estate billionaire Grant Cardone has also announced additional Bitcoin purchases, strengthening market confidence and signaling a long-term hold.
MarketWhisper26m ago
Hyperliquid whale puts on a short position in Bitcoin worth 53 million, the market is wary of downside risk
On the decentralized sustainable derivatives exchange Hyperliquid, a whale trader opened a leveraged short Bitcoin position worth $53.0 million, with a liquidation price of $80,630. At the same time, the trader also holds short positions in silver and multiple altcoins, as well as a long position in Brent crude oil, reflecting its bearish outlook on the current market. Geopolitics, regulatory uncertainty, and the upcoming employment data make up the threefold pressure weighing on this week’s market.
MarketWhisper44m ago
BTC 15-minute surge 0.80%: spot incremental buy orders and changes in the order book structure drive a price breakout
From 2026-03-31 01:15 to 2026-03-31 01:30 (UTC), BTC showed a clear breakout move. The candlestick data indicates a return rate of +0.80%, with the price ranging between 67,241.1 and 67,884.3 USDT, and a recorded amplitude of 0.96%. During this period, trading activity in the market was active, risk appetite rebounded, and short-term bullish sentiment dominated, driving the price to break through local resistance.
The main driving forces behind this breakout were the synchronized rise in trading volume across the spot and derivatives (futures/perpetual) markets, along with a significant net inflow of funds into exchanges. The spot trading volume surged sharply compared with the average value of the previous hour.
GateNews1h ago
Bitcoin (BTC) Stuck in a ‘No Trade Zone:’ When Is the Next Big Move Coming?
The primary cryptocurrency has experienced significant volatility lately, mainly due to the geopolitical tension caused by the war in the Middle East.
One popular analyst described the current price area as a “no-trade zone,” arguing that a clear move in either direction will depend on how BTC
CryptoPotato1h ago
Why is Bitcoin up today? Trump pauses strikes on Iranian energy facilities, and the Fed signals support for risk markets
Bitcoin rebounded to above $67,000 on March 31, mainly driven by signals from U.S.-Iran diplomacy and the Federal Reserve’s decision to keep interest rates unchanged. Market sentiment temporarily improved, but Iran’s Ministry of Foreign Affairs said that the lack of direct negotiations could limit the rebound. The potential impact of the Strait of Hormuz toll bill on supply chains is pushing up oil prices and putting pressure on the market; it’s important to closely monitor future price movements.
MarketWhisper1h ago
Today’s Crypto Fear and Greed Index rose to 11, and the market is in a state of extreme fear
Gate News, March 31, according to Alternative.me data, today the crypto Fear and Greed Index rose to 11, putting the market in extreme fear. Yesterday, the index was 8, also in extreme fear.
GateNews1h ago
