SUI trades near $0.97 ahead of Grayscale’s GSUI ETF launch on NYSE Arca, with weekly gains of 10% and rising open interest.
SUI price is trading near key resistance levels as Grayscale prepares to launch its Sui Staking ETF under the ticker GSUI.
The token has posted steady weekly gains, and traders are watching whether the ETF debut could drive further price movement.
SUI Records Weekly Gains Ahead of ETF Launch
SUI traded around $0.97 on Wednesday after a modest daily increase of less than 1%.
Over the past seven days, the token has gained about 10%, reflecting gradual upward momentum.
The broader crypto market has also shown signs of recovery. Bitcoin traded above $68,000, while Ethereum hovered near the $2,000 level.
Other major altcoins such as Solana, XRP, and Dogecoin recorded mild gains during the same period.
SUI has remained above the $0.90 support zone in recent sessions. Market participants are monitoring whether sustained trading above $0.98 could support additional upside pressure.
Grayscale’s GSUI ETF Set for NYSE Arca Trading
Grayscale Investment confirmed that its Sui Staking ETF will begin trading on NYSE Arca under the ticker GSUI.
The launch follows an 8-A filing with the US Securities and Exchange Commission, which became effective automatically.
Grayscale Sui Staking ETF (Ticker: $GSUI) offers investors direct exposure to $SUI. 💧 $GSUI starts trading tomorrow on @NYSE Arca. pic.twitter.com/HzhTyAd3pd
— Grayscale (@Grayscale) February 18, 2026
The ETF is designed to provide regulated exposure to the SUI token. Investors will gain access to SUI price performance and potential staking rewards through a traditional exchange-traded product structure.
The fund carries a management fee of 0.35%, though Grayscale stated that the fee will be waived for the first three months.
The waiver remains in place until assets under management reach $1 billion. The launch adds another crypto-linked ETF to US markets.
**Related Reading: **$143M in Short Liquidations Stack Above SUI – What Happens Next?
Technical Indicators and Price Levels in Focus
SUI recently tested resistance near the $1.20 level after stabilizing above $1.00. Analysts are observing whether the token can break above this resistance and approach the $1.50 range.
The Relative Strength Index stands near 52, which suggests moderate bullish momentum without entering overbought territory. Meanwhile, the Moving Average Convergence Divergence indicator shows the short-term line approaching the signal line.
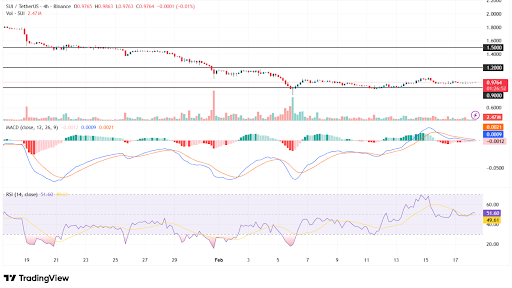
SUI consolidates near resistance as momentum cools. Source: TradingView
Open interest in SUI derivatives rose by 0.82% to about $512.65 million. The increase suggests growing trading activity as the ETF launch approaches.
Traders continue to monitor the $0.90 support level, as a break below that area could shift short-term price direction.
Disclaimer: The information on this page may come from third parties and does not represent the views or opinions of Gate. The content displayed on this page is for reference only and does not constitute any financial, investment, or legal advice. Gate does not guarantee the accuracy or completeness of the information and shall not be liable for any losses arising from the use of this information. Virtual asset investments carry high risks and are subject to significant price volatility. You may lose all of your invested principal. Please fully understand the relevant risks and make prudent decisions based on your own financial situation and risk tolerance. For details, please refer to
Disclaimer.
Related Articles
Analyst Says Bitcoin Indicators Show Early Signs of Market Recovery
Stablecoin liquidity rose by ~$8B since February, signaling potential improved market trading conditions.
Inter-exchange Flow Pulse turned positive, indicating more Bitcoin moving to derivatives platforms.
Long-term holders retain ~79% of supply, showing gradual supply transfers rather
CryptoFrontNews2h ago
Dogecoin at a Turning Point — Will $0.094 Resistance Finally Break?
Dogecoin was trading between $0.0925 and $0.09173 with the price stabilizing around $0.0925.
The immediate $0.09443 resistance caps the current range. A move above this level could expand today’s trading activity.
Past historical price movements coincide with a number of trend support res
CryptoNewsLand3h ago
XRP Breaks $1.40 Resistance as Volume Surge Lifts Momentum
Key Insights
XRP surged past the $1.40 resistance after trading volume climbed nearly 13%, signaling renewed trader interest and stronger short-term momentum.
Ripple’s collaboration with Mastercard through the Crypto Partner program increased market attention as investors anticipate
CryptoNewsLand3h ago
XRP Price Structure Tightens While Heatmap Highlights $1.30 Liquidity Zone
XRP trades near $1.37 support after a 0.9% daily decline, while the $1.44 level remains the immediate resistance in the current range.
A three-week liquidity heatmap highlights a large order cluster around $1.30, indicating a strong liquidity zone below price.
A three-month Gaussian
CryptoNewsLand4h ago
Internet Computer Price Nears Wedge Breakout — Will Momentum Hold Above $2.54?
Internet Computers continues trading within a falling wedge that has developed since November. Price now approaches the pattern’s upper boundary as volatility tightens.
ICP is trading around the $2.57 mark which is a bit higher than the $2.54 support. In the meantime, the immediate
CryptoNewsLand4h ago