
Key Takeaways
-
Algorand (ALGO) is consolidating after a 13% decline over the past 60 days, while showing stabilization in the last month.
-
The daily chart reveals a repeating bullish fractal, similar to the setup that triggered ALGO’s 300% rally in November 2024.
-
Price is holding inside a long-term accumulation zone between $0.11 and $0.1530.
-
The 200-day moving average near $0.1912 is acting as key resistance and breakout confirmation level.
-
A successful reclaim of the 200 MA could open the path toward $0.60 and the ascending resistance trendline, while a drop below $0.11 would invalidate the bullish setup.
ALGO, the native token of Algorand’s Layer-1 blockchain, has shown steady but muted momentum over the past 30 days, helping slow down its broader correction. Despite this stabilization, ALGO remains down more than 13% over the last 60 days, keeping sentiment cautious across the market.
That said, when looking beyond short-term price noise, the daily chart is beginning to tell a familiar story. The current structure closely resembles a bullish fractal that, in the past, preceded a powerful breakout rally—raising an important question for traders: is this just consolidation, or a quiet accumulation phase before the next move?
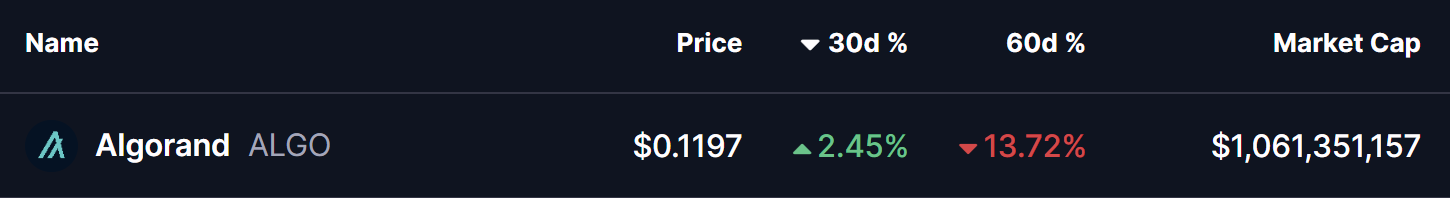
Source: Coinmarketcap
Fractal Setup Hints at a Bullish Reversal
On the daily timeframe, ALGO is displaying early signs of a repeating bullish structure, built around three key technical elements:
-
A rejection from the long-term ascending resistance trendline
-
A prolonged accumulation zone at major historical support
-
A potential reclaim of the 200-day moving average
The current corrective phase began in December 2024, when ALGO was rejected near the ascending resistance trendline around $0.60. That rejection triggered a deep pullback of more than 80%, eventually driving price back into the long-term demand zone between $0.11 and $0.1530—a region that has repeatedly acted as an accumulation area on the chart.
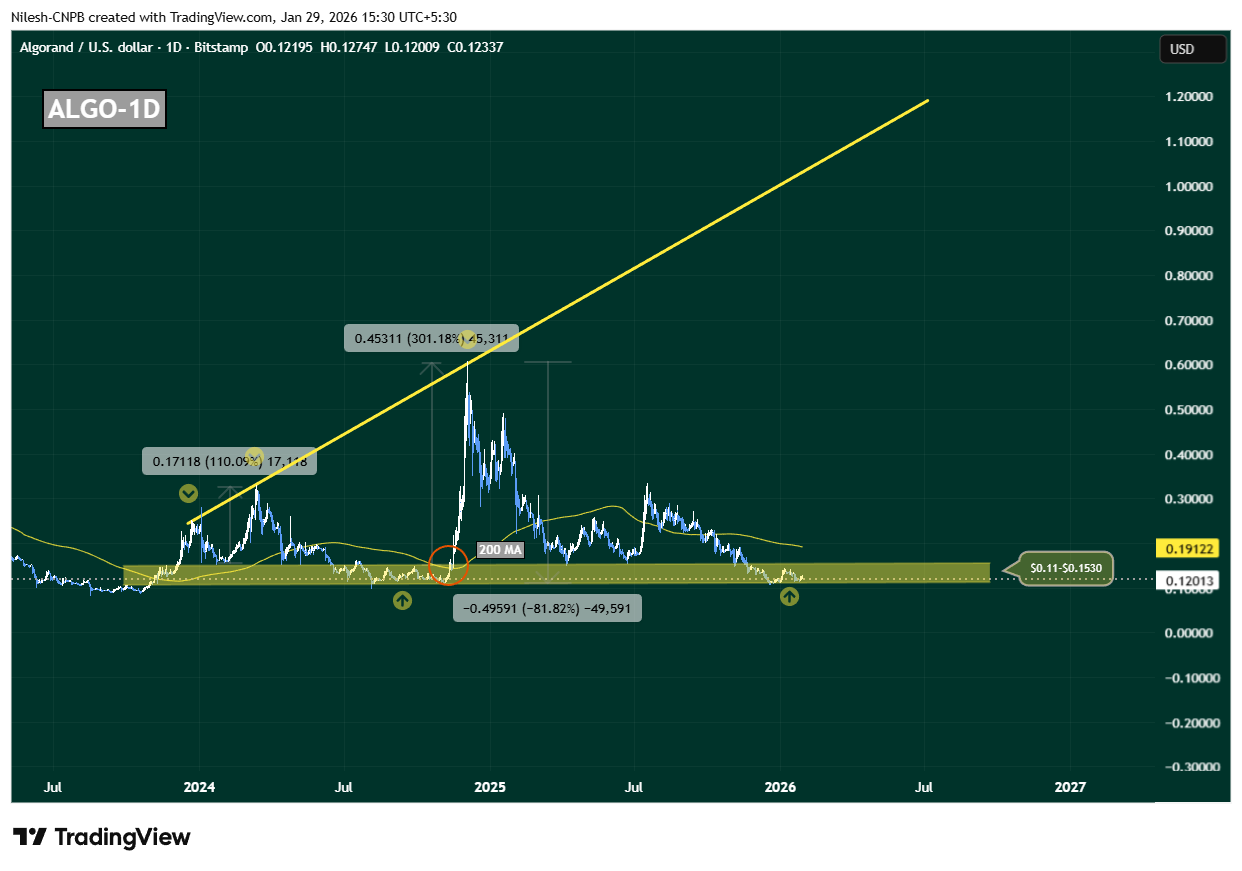
Algorand (ALGO) Daily Chart/Coinsprobe (Source: Tradingview)
This zone is not just technically important; it has also served as a launchpad during previous cycles, where downside momentum stalled and long-term buyers quietly stepped in.
History Rhymes on the ALGO Chart
What makes this setup particularly compelling is how closely it mirrors November 2024’s breakout structure. Back then, ALGO spent extended time consolidating near the same support band before reclaiming the 200-day moving average. Once that level flipped into support, price accelerated sharply—resulting in a 300% rally toward the ascending resistance trendline.
Today, ALGO is once again compressing inside this accumulation range, while the 200-day moving average sits overhead near $0.1912, acting as dynamic resistance. This alignment suggests the market may be approaching another inflection point.
What’s Next for ALGO?
At present, ALGO is hovering near $0.12, firmly inside its long-term accumulation zone. As long as price holds above this region, the broader bullish fractal remains intact.
A clean and sustained reclaim of the 200-day moving average around $0.1912 would be a critical confirmation signal. If bulls manage to flip this level into support, it would closely replicate previous breakout conditions and could trigger a sharp upside expansion. In that scenario, $0.60 becomes a realistic medium-term target, with further upside possible toward the ascending resistance trendline if momentum builds.
However, the structure is not without risk. A decisive breakdown below $0.11 would weaken the accumulation thesis, signal loss of long-term support, and open the door for deeper downside.
For now, ALGO sits at a make-or-break zone. The chart suggests patience is key—but if history repeats, this quiet phase may not last much longer.
Disclaimer: The views and analysis presented in this article are for informational purposes only and reflect the author’s perspective, not financial advice. Technical patterns and indicators discussed are subject to market volatility and may or may not yield the anticipated results. Investors are advised to exercise caution, conduct independent research, and make decisions aligned with their individual risk tolerance.
About Author: Nilesh Hembade is the Founder and Lead Author of Coinsprobe, with over 5 years of experience in the cryptocurrency and blockchain industry. Since launching Coinsprobe in 2023, he has been providing daily, research-driven insights through in-depth market analysis, on-chain data, and technical research.
Disclaimer: The information on this page may come from third parties and does not represent the views or opinions of Gate. The content displayed on this page is for reference only and does not constitute any financial, investment, or legal advice. Gate does not guarantee the accuracy or completeness of the information and shall not be liable for any losses arising from the use of this information. Virtual asset investments carry high risks and are subject to significant price volatility. You may lose all of your invested principal. Please fully understand the relevant risks and make prudent decisions based on your own financial situation and risk tolerance. For details, please refer to
Disclaimer.
Related Articles
CryptoQuant: Sustainable futures longs are catalyzing BTC and ETH to rise, not liquidation-triggered
CryptoQuant research indicates that after the ceasefire agreement, the price rise in Bitcoin and Ethereum was driven by new longs establishing positions, not by short liquidations. The open interest in BTC and ETH perpetual futures increased by $2.1 billion and $2.2 billion, respectively. Renewed institutional buying in the U.S. brought the Coinbase premium back into positive territory. Bitcoin broke above $69,400, targeting $79,000.
MarketWhisper15m ago
ETH 15-minute pump of 0.60%: exchange net capital outflows and on-chain large transfers drive a short-term rebound
2026-04-10 01:30 to 2026-04-10 01:45 (UTC), ETH traded within the 2185.0 to 2204.03 USDT range. The candlestick return was +0.60%, and the 15-minute intraday swing was 0.87%. During this period, mainstream market attention increased, with trading volume expanding by about 20% compared with the periods before and after, indicating stronger short-term liquidity.
The main drivers behind this unusual move were exchange net outflows and active on-chain large transfers. On-chain data shows that during this period, ETH saw multiple transactions, each over 8,000 ETH,
GateNews25m ago
Longtime Bitcoin whale dumps 271 million, replaying the crash scene from last January
Last week, Bitcoin whales sold about $271 million, setting the largest single-day activity since January. The market reacted well to this selloff: long-term holders significantly increased their Bitcoin holdings, indicating the market’s absorption capacity has strengthened. Analysts predict that Bitcoin could remain in the $70,000 to $72,000 range. Compared with the market conditions during the January selloff, this time has been more stable. Long-term holders’ net positions turned positive, and technical indicators suggest the market is approaching a bottom, with clear signs of a future recovery.
MarketWhisper28m ago
Why is Bitcoin up today? “Alireza” opens direct negotiations, and Trump demands that Iran “immediately” stop tanker fees
Bitcoin’s official rise today reached $71,800, mainly because Israel and Lebanon have begun direct negotiations, reducing market concerns about an Iran ceasefire agreement. In addition, a weaker US dollar and continued buying by institutional investors also pushed prices higher. On the technical side, Bitcoin’s key support levels are $68,500 to $70,000. A break above $76,000 to $78,000 could prompt another test of $80,000 to $85,000.
MarketWhisper1h ago
Gold falls to $4,758, the BTC Volatility Index drops 1.77%, and WTI crude oil rises 0.44%
April 10, gold and silver prices fell slightly, trading at $4,758.37 per ounce and $75.165 per ounce, respectively. The Bitcoin Volatility Index (BVIX) dropped to 44.36, and in the foreign exchange market, the U.S. dollar rose against the offshore yuan and the Japanese yen. Major European stock indexes generally declined, while WTI and Brent crude oil rose slightly. The Gate platform supports trading a variety of financial market products.
GateNews1h ago
Israel agrees to negotiations with Lebanon, US stocks rally, and Bitcoin briefly spikes to 73K
Israeli Prime Minister Benjamin Netanyahu agrees to hold direct negotiations with Lebanon. This news boosts gains in the U.S. stock market’s S&P 500, while oil prices fall. Bitcoin’s price briefly rose to 73K; market sentiment improved slightly, but overall it has not fully rebounded. Trump urged Iran to stop its attacks to facilitate negotiations, but shipping through the strait has not improved yet.
ChainNewsAbmedia2h ago
