
Key Takeaways
-
Virtuals Protocol (VIRTUAL) is holding around 20% monthly gains despite short-term market weakness.
-
The 4H chart shows a developing inverse head and shoulders pattern, a classic bullish reversal structure.
-
Price recently faced rejection near the $0.85 neckline, suggesting the right shoulder is still forming.
-
A potential dip toward the $0.78 support zone could complete the pattern and attract buyers.
-
A confirmed breakout above $0.85 may open the door for a stronger upside move, while losing $0.78 could delay the bullish setup.
Virtuals Protocol (VIRTUAL), the native token of the decentralized infrastructure and launchpad powering autonomous AI agents, has been holding up relatively well despite recent market-wide hesitation. The token is still sitting on around 20% monthly gains, although it is trading slightly in the red today in line with broader crypto sentiment.
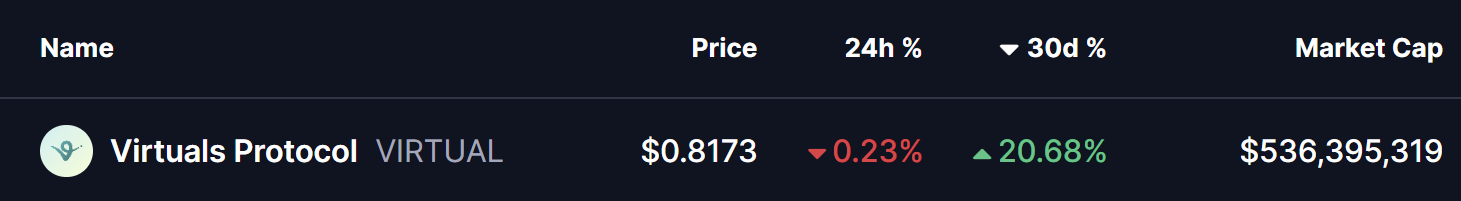
Source: Coinmarketcap
However, when you zoom into the chart, the price action tells a more interesting story. Beneath the short-term weakness, VIRTUAL appears to be building a classic bullish reversal structure, one that could act as the base for a stronger upside move if confirmed.
Inverse Head and Shoulders Pattern Takes Shape
On the 4-hour timeframe, VIRTUAL has carved out a clear inverse head and shoulders pattern, a formation often associated with trend reversals after a prolonged pullback.
-
The left shoulder developed near the $0.80 zone, where buyers initially stepped in.
-
This was followed by a deeper decline toward $0.75, forming the head of the structure and marking the local low.
-
Price then rebounded toward the descending neckline resistance around $0.85, where it faced rejection once again.
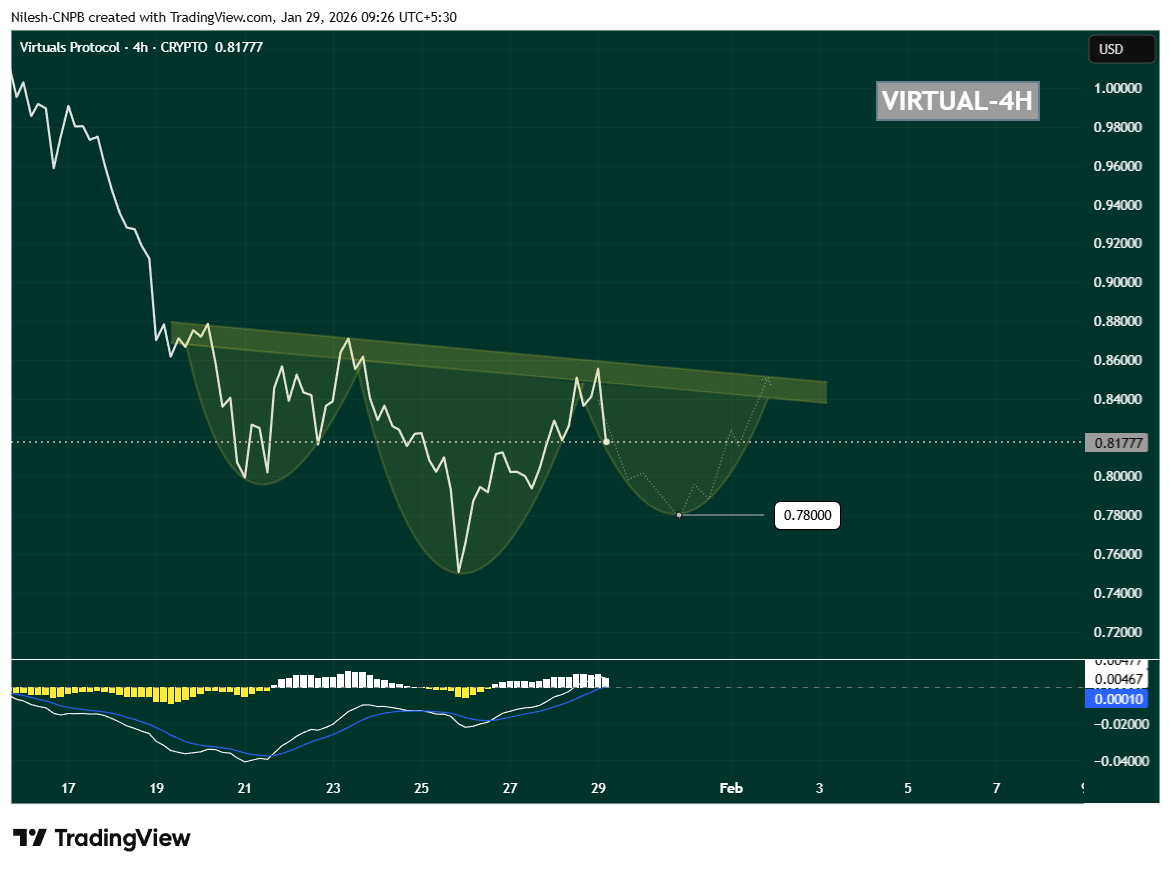
VIRTUAL 4H Chart/Coinsprobe (Source: Tradingview)
Following this rejection, VIRTUAL has started to drift lower and is currently trading near $0.8177, suggesting that the right shoulder may still be forming. This behavior fits well with the textbook structure of the pattern and keeps the bullish setup technically valid for now.
Momentum Signals Support the Setup
Momentum indicators are also worth watching closely. On the same timeframe, the MACD is cooling off and curling downward, reflecting short-term weakness rather than a full trend breakdown. In many cases, this kind of MACD reset during right-shoulder formation actually helps fuel the next impulsive move higher once buyers regain control.
As long as selling pressure remains controlled and price avoids a sharp breakdown, this momentum reset can work in favor of the bulls.
What’s Next for VIRTUAL?
If the pattern continues to play out, VIRTUAL could dip toward the $0.78 region, which aligns well with the projected right-shoulder bottom visible on the chart. This zone may act as a critical demand area where buyers look to step back in.
A strong bounce from this region, followed by renewed buying pressure, would increase the probability of a bullish breakout attempt toward the $0.85 neckline. A clean move above this resistance would confirm the inverse head and shoulders pattern and signal a potential shift back into a short-term uptrend.
On the downside, losing the $0.78 support decisively would weaken the structure and delay the bullish thesis, potentially opening the door for deeper consolidation.
For now, VIRTUAL is at a key technical crossroads. The structure remains constructive, the pattern is intact, and the chart suggests that the next major move—up or down—could arrive once this right shoulder finishes forming. Traders will be watching closely how price reacts around support in the coming sessions.
Disclaimer: The views and analysis presented in this article are for informational purposes only and reflect the author’s perspective, not financial advice. Technical patterns and indicators discussed are subject to market volatility and may or may not yield the anticipated results. Investors are advised to exercise caution, conduct independent research, and make decisions aligned with their individual risk tolerance.
About Author: Nilesh Hembade is the Founder and Lead Author of Coinsprobe, with over 5 years of experience in the cryptocurrency and blockchain industry. Since launching Coinsprobe in 2023, he has been providing daily, research-driven insights through in-depth market analysis, on-chain data, and technical research.
Disclaimer: The information on this page may come from third parties and does not represent the views or opinions of Gate. The content displayed on this page is for reference only and does not constitute any financial, investment, or legal advice. Gate does not guarantee the accuracy or completeness of the information and shall not be liable for any losses arising from the use of this information. Virtual asset investments carry high risks and are subject to significant price volatility. You may lose all of your invested principal. Please fully understand the relevant risks and make prudent decisions based on your own financial situation and risk tolerance. For details, please refer to
Disclaimer.
Related Articles
Michael Saylor’s Strategy adds another 88,000 bitcoins in Q1 2026, setting a new historical record
Michael Saylor’s Strategy increased its Bitcoin holdings by more than 88,000 coins in the first quarter of 2026, bringing total holdings to nearly 739,000 coins and cementing its position as the world’s largest corporate holder. The move was completed through $42 billion in financing, reflecting Saylor’s confidence in long-term value, even though overall market sentiment remains relatively bearish. The accumulation strategy shows the contrarian thinking of institutional investors in a bear market, but it also introduces risks of price volatility and leverage financing.
GateNews5m ago
AI memory plunges trigger a 9% drop in Nvidia shares; technical charts show a potential 11% pullback
NVIDIA’s stock price closed above $165 on March 30. In the recent period, it has fallen more than 9%, nearing the neckline level of a head-and-shoulders top pattern. The decline was driven by a drop in AI memory demand and a sharp selloff in the shares of companies such as Micron Technology. The options market has seen an increase in bullish positions, which could offer a buying opportunity for investors. The future direction of the stock price still depends on changes in memory demand and technical indicators.
GateNews7m ago
Bitcoin Price Rises Ahead of Trump’s Key Iran War Announcement
Bitcoin's volatility persists amid escalating war tensions with Iran, spiking nearly to $69,000 following speculation about President Trump's upcoming speech addressing the situation. Contradictory statements regarding the war's continuation add to market uncertainty.
CryptoPotato11m ago
Fidelity: This round of Bitcoin’s pullback is only 50%, and the bottom may be in late September
Fidelity Digital Assets says that this round of the Bitcoin market pullback is about 50%, lower than the previous 80% to 90%, indicating that volatility is declining and institutional confidence is increasing. Analysts believe Bitcoin is gradually shifting into a stable store-of-value tool, with promising future application prospects. From a technical perspective, the price is hovering around a key support level; if it holds that level, it could provide an opportunity for medium- to long-term investors.
GateNews11m ago
The crypto race against quantum explodes, with many tokens up as much as 50%
The crypto race against quantum attacks is booming, with many tokens up as much as 50%
The cryptocurrency market is seeing a notable wave of shifting priorities as investors begin favoring assets believed to be capable of withstanding risks from quantum computers. Amid growing concerns about cybersecurity
TapChiBitcoin15m ago
Quantum threat controversy flares up again, with anti-quantum encrypted cryptocurrencies seeing a short-term increase of up to 50%
Google’s quantum computing research results have prompted the cryptocurrency market to reassess technical risk, but Bitcoin and Ethereum prices have shown limited volatility. Anti-quantum cryptographic tokens have performed strongly, with some gains reaching 50%. Although the quantum threat remains in the theoretical stage, investors’ attention to post-quantum cryptography projects may drive volatility in related asset prices.
GateNews21m ago
