
Key Takeaways
-
SAND price is showing early signs of stabilization after recent downside pressure.
-
Buyers appear to be defending a key support zone, hinting at a potential short-term rebound.
-
A breakout above nearby resistance could open the door for a stronger recovery move.
Gaming-focused crypto tokens are back in the spotlight after Axie Infinity (AXS) posted a sharp rally of over 16% in a single day and more than 246% over the past month, reigniting optimism around the gaming narrative. Riding this renewed momentum, Sandbox (SAND) has also stepped into focus, climbing nearly 45% as overall market sentiment turns constructive.
Beyond the recent price bounce, the technical structure on the chart is starting to tell a bigger story, hinting that SAND may be setting up for a bullish continuation move.
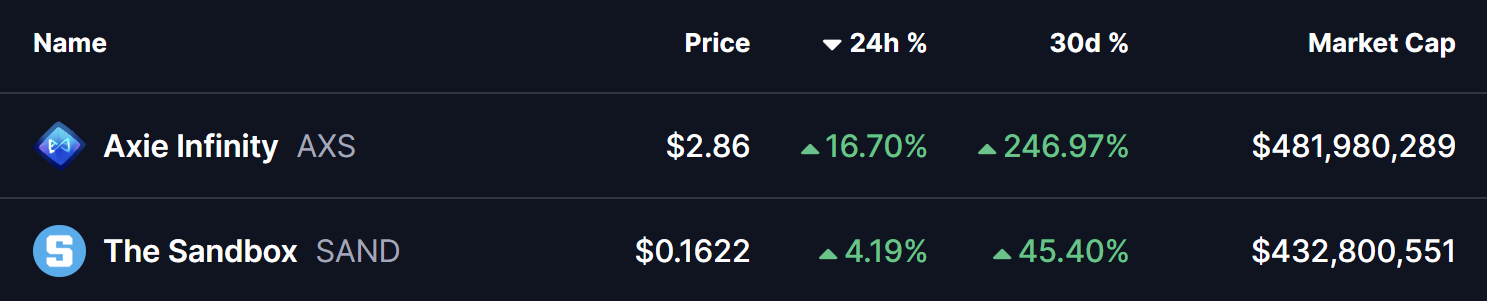
Source: Coinmarketcap
Descending Broadening Wedge Pattern in Play
On the daily timeframe, SAND is trading within a descending broadening wedge — a bullish reversal pattern that often develops during corrective phases before a trend shift. This structure reflects increasing volatility, with price gradually compressing while buyers quietly regain control.
During the latest pullback, SAND successfully retested the lower boundary of the wedge near the $0.11 zone, an area that has repeatedly acted as strong demand. Buyers stepped in aggressively at this level, triggering a rebound that pushed price toward $0.1711, placing SAND right near the wedge’s upper resistance trendline.
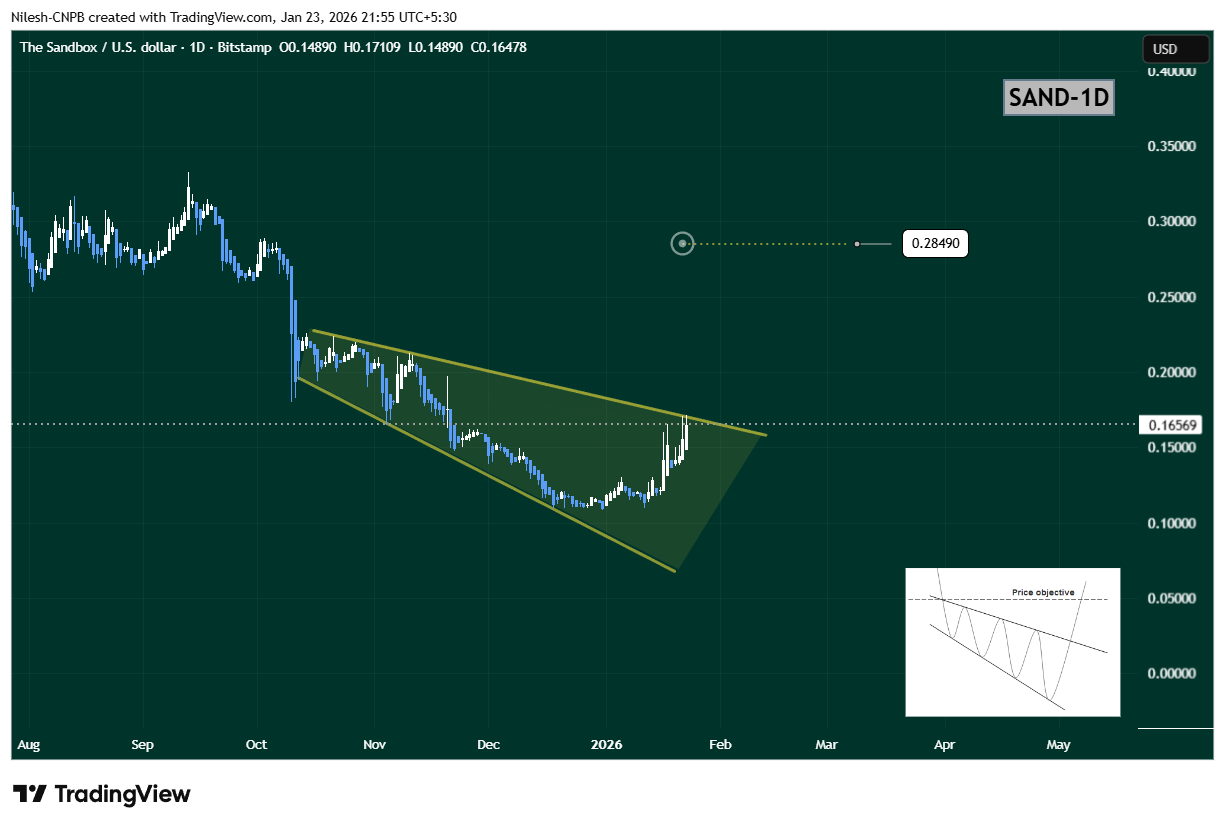
Sandbox (SAND) Daily Chart/Coinsprobe (Source: Tradingview)
The steady rise toward this upper boundary suggests growing bullish momentum and increasing breakout pressure.
What’s Next for SAND?
If buyers manage to push SAND above the upper wedge resistance near $0.1711, it would confirm a bullish breakout from the pattern. In that scenario, the chart opens the door for a move toward the $0.2849 target, which aligns with the measured move of the wedge and represents roughly 73% upside from current levels.
However, if price faces rejection at resistance, SAND could continue consolidating within the wedge structure. In that case, the $0.13–$0.14 region will act as an important short-term support zone to watch.
Bottom Line
SAND’s overall technical structure remains constructive. With a bullish descending broadening wedge in play, buyers defending key support, and gaming tokens gaining renewed attention, Sandbox appears to be positioning for a potential breakout. A confirmed move above resistance could mark the beginning of a stronger upside phase in the sessions ahead.
Disclaimer: The views and analysis presented in this article are for informational purposes only and reflect the author’s perspective, not financial advice. Technical patterns and indicators discussed are subject to market volatility and may or may not yield the anticipated results. Investors are advised to exercise caution, conduct independent research, and make decisions aligned with their individual risk tolerance.
About Author: Nilesh Hembade is the Founder and Lead Author of Coinsprobe, with over 5 years of experience in the cryptocurrency and blockchain industry. Since launching Coinsprobe in 2023, he has been providing daily, research-driven insights through in-depth market analysis, on-chain data, and technical research.
Disclaimer: The information on this page may come from third parties and does not represent the views or opinions of Gate. The content displayed on this page is for reference only and does not constitute any financial, investment, or legal advice. Gate does not guarantee the accuracy or completeness of the information and shall not be liable for any losses arising from the use of this information. Virtual asset investments carry high risks and are subject to significant price volatility. You may lose all of your invested principal. Please fully understand the relevant risks and make prudent decisions based on your own financial situation and risk tolerance. For details, please refer to
Disclaimer.
Related Articles
CryptoQuant: Sustainable futures longs are catalyzing BTC and ETH to rise, not liquidation-triggered
CryptoQuant research indicates that after the ceasefire agreement, the price rise in Bitcoin and Ethereum was driven by new longs establishing positions, not by short liquidations. The open interest in BTC and ETH perpetual futures increased by $2.1 billion and $2.2 billion, respectively. Renewed institutional buying in the U.S. brought the Coinbase premium back into positive territory. Bitcoin broke above $69,400, targeting $79,000.
MarketWhisper15m ago
ETH 15-minute pump of 0.60%: exchange net capital outflows and on-chain large transfers drive a short-term rebound
2026-04-10 01:30 to 2026-04-10 01:45 (UTC), ETH traded within the 2185.0 to 2204.03 USDT range. The candlestick return was +0.60%, and the 15-minute intraday swing was 0.87%. During this period, mainstream market attention increased, with trading volume expanding by about 20% compared with the periods before and after, indicating stronger short-term liquidity.
The main drivers behind this unusual move were exchange net outflows and active on-chain large transfers. On-chain data shows that during this period, ETH saw multiple transactions, each over 8,000 ETH,
GateNews25m ago
Longtime Bitcoin whale dumps 271 million, replaying the crash scene from last January
Last week, Bitcoin whales sold about $271 million, setting the largest single-day activity since January. The market reacted well to this selloff: long-term holders significantly increased their Bitcoin holdings, indicating the market’s absorption capacity has strengthened. Analysts predict that Bitcoin could remain in the $70,000 to $72,000 range. Compared with the market conditions during the January selloff, this time has been more stable. Long-term holders’ net positions turned positive, and technical indicators suggest the market is approaching a bottom, with clear signs of a future recovery.
MarketWhisper28m ago
Why is Bitcoin up today? “Alireza” opens direct negotiations, and Trump demands that Iran “immediately” stop tanker fees
Bitcoin’s official rise today reached $71,800, mainly because Israel and Lebanon have begun direct negotiations, reducing market concerns about an Iran ceasefire agreement. In addition, a weaker US dollar and continued buying by institutional investors also pushed prices higher. On the technical side, Bitcoin’s key support levels are $68,500 to $70,000. A break above $76,000 to $78,000 could prompt another test of $80,000 to $85,000.
MarketWhisper1h ago
Gold falls to $4,758, the BTC Volatility Index drops 1.77%, and WTI crude oil rises 0.44%
April 10, gold and silver prices fell slightly, trading at $4,758.37 per ounce and $75.165 per ounce, respectively. The Bitcoin Volatility Index (BVIX) dropped to 44.36, and in the foreign exchange market, the U.S. dollar rose against the offshore yuan and the Japanese yen. Major European stock indexes generally declined, while WTI and Brent crude oil rose slightly. The Gate platform supports trading a variety of financial market products.
GateNews1h ago
Israel agrees to negotiations with Lebanon, US stocks rally, and Bitcoin briefly spikes to 73K
Israeli Prime Minister Benjamin Netanyahu agrees to hold direct negotiations with Lebanon. This news boosts gains in the U.S. stock market’s S&P 500, while oil prices fall. Bitcoin’s price briefly rose to 73K; market sentiment improved slightly, but overall it has not fully rebounded. Trump urged Iran to stop its attacks to facilitate negotiations, but shipping through the strait has not improved yet.
ChainNewsAbmedia2h ago
