
Key Takeaways
-
Virtuals Protocol (VIRTUAL) is holding around 20% monthly gains despite short-term market weakness.
-
The 4H chart shows a developing inverse head and shoulders pattern, a classic bullish reversal structure.
-
Price recently faced rejection near the $0.85 neckline, suggesting the right shoulder is still forming.
-
A potential dip toward the $0.78 support zone could complete the pattern and attract buyers.
-
A confirmed breakout above $0.85 may open the door for a stronger upside move, while losing $0.78 could delay the bullish setup.
Virtuals Protocol (VIRTUAL), the native token of the decentralized infrastructure and launchpad powering autonomous AI agents, has been holding up relatively well despite recent market-wide hesitation. The token is still sitting on around 20% monthly gains, although it is trading slightly in the red today in line with broader crypto sentiment.
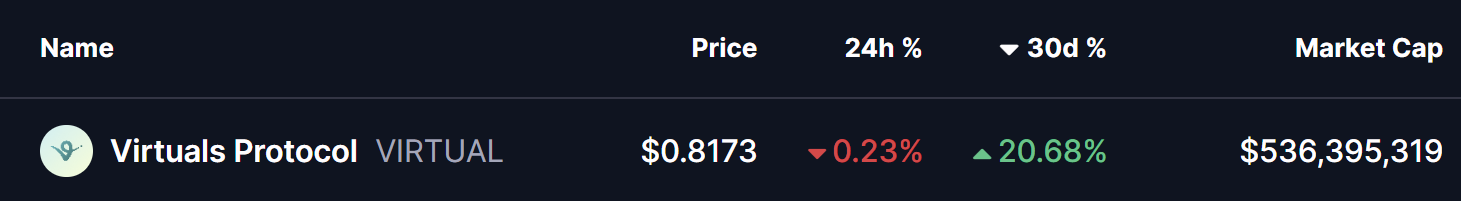
Source: Coinmarketcap
However, when you zoom into the chart, the price action tells a more interesting story. Beneath the short-term weakness, VIRTUAL appears to be building a classic bullish reversal structure, one that could act as the base for a stronger upside move if confirmed.
Inverse Head and Shoulders Pattern Takes Shape
On the 4-hour timeframe, VIRTUAL has carved out a clear inverse head and shoulders pattern, a formation often associated with trend reversals after a prolonged pullback.
-
The left shoulder developed near the $0.80 zone, where buyers initially stepped in.
-
This was followed by a deeper decline toward $0.75, forming the head of the structure and marking the local low.
-
Price then rebounded toward the descending neckline resistance around $0.85, where it faced rejection once again.
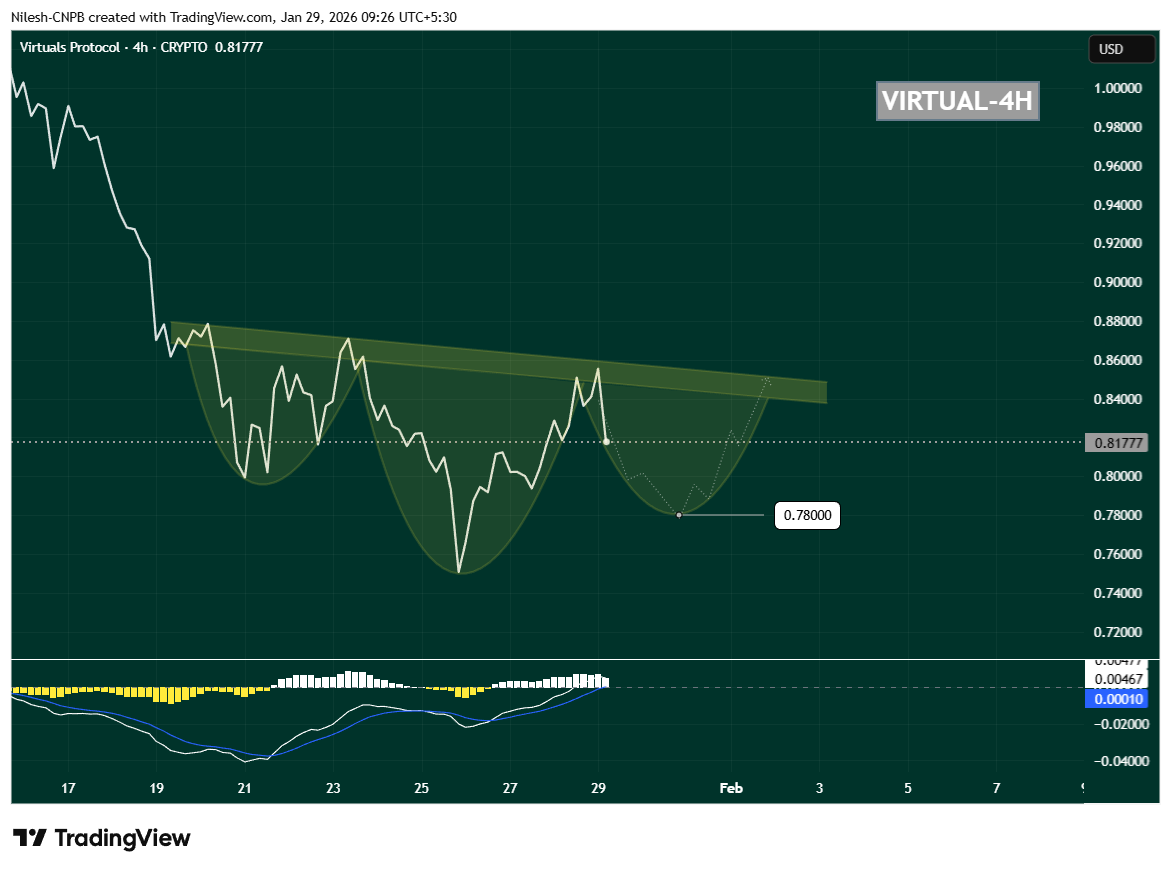
VIRTUAL 4H Chart/Coinsprobe (Source: Tradingview)
Following this rejection, VIRTUAL has started to drift lower and is currently trading near $0.8177, suggesting that the right shoulder may still be forming. This behavior fits well with the textbook structure of the pattern and keeps the bullish setup technically valid for now.
Momentum Signals Support the Setup
Momentum indicators are also worth watching closely. On the same timeframe, the MACD is cooling off and curling downward, reflecting short-term weakness rather than a full trend breakdown. In many cases, this kind of MACD reset during right-shoulder formation actually helps fuel the next impulsive move higher once buyers regain control.
As long as selling pressure remains controlled and price avoids a sharp breakdown, this momentum reset can work in favor of the bulls.
What’s Next for VIRTUAL?
If the pattern continues to play out, VIRTUAL could dip toward the $0.78 region, which aligns well with the projected right-shoulder bottom visible on the chart. This zone may act as a critical demand area where buyers look to step back in.
A strong bounce from this region, followed by renewed buying pressure, would increase the probability of a bullish breakout attempt toward the $0.85 neckline. A clean move above this resistance would confirm the inverse head and shoulders pattern and signal a potential shift back into a short-term uptrend.
On the downside, losing the $0.78 support decisively would weaken the structure and delay the bullish thesis, potentially opening the door for deeper consolidation.
For now, VIRTUAL is at a key technical crossroads. The structure remains constructive, the pattern is intact, and the chart suggests that the next major move—up or down—could arrive once this right shoulder finishes forming. Traders will be watching closely how price reacts around support in the coming sessions.
Disclaimer: The views and analysis presented in this article are for informational purposes only and reflect the author’s perspective, not financial advice. Technical patterns and indicators discussed are subject to market volatility and may or may not yield the anticipated results. Investors are advised to exercise caution, conduct independent research, and make decisions aligned with their individual risk tolerance.
About Author: Nilesh Hembade is the Founder and Lead Author of Coinsprobe, with over 5 years of experience in the cryptocurrency and blockchain industry. Since launching Coinsprobe in 2023, he has been providing daily, research-driven insights through in-depth market analysis, on-chain data, and technical research.
Disclaimer: The information on this page may come from third parties and does not represent the views or opinions of Gate. The content displayed on this page is for reference only and does not constitute any financial, investment, or legal advice. Gate does not guarantee the accuracy or completeness of the information and shall not be liable for any losses arising from the use of this information. Virtual asset investments carry high risks and are subject to significant price volatility. You may lose all of your invested principal. Please fully understand the relevant risks and make prudent decisions based on your own financial situation and risk tolerance. For details, please refer to
Disclaimer.
Related Articles
Pi Network RPC server startup, supply pressure obstructs a technical rebound for PI
Pi Network announced that its testnet remote procedure call (RPC) servers are now live, laying the groundwork for building a smart contract ecosystem. Although this news is seen as a positive, the core team’s selling of more than 21.8 million PI tokens, along with the ongoing supply pressure stemming from user top-ups, has still exerted downside pressure on the market. Technical analysis shows that the support level for the PI token is $0.1736; the future price action needs to be closely watched.
MarketWhisper45m ago
A whale-led selloff is driving the Bitcoin market, and ETF institutional buy pressure is unable to turn the tide
A CryptoQuant report indicates that as of the end of March, Bitcoin’s “apparent demand” is -63,000 BTC, showing that the market has an oversupply situation, and institutional buying cannot offset retail selling. Starting in mid-2025, the giant whales began large-scale selling, pushing the market into a distribution phase. Although ETF institutional buying has increased, it has not been able to change the weak demand situation, and weakening domestic U.S. demand may further affect the market. Easing geopolitical tensions could become a catalyst for a short-term rebound.
MarketWhisper1h ago
BTC 15-minute drop of 0.73%: Technical support fails and on-chain congestion converges to suppress the rebound
From 2026-04-02 02:00 to 2026-04-02 02:15 (UTC), the BTC price fluctuated within the 66,858.6 - 67,355.0 USDT range. Over the 15 minutes, the return was -0.73%, and the amplitude reached 0.74%. During this period, market attention increased, short-term volatility intensified, and investors’ sentiment clearly shifted toward caution.
The main driving force behind this abnormal move was that the key technical support level of $66,700 was broken, along with the RSI falling below 30, indicating that short-term momentum weakened rapidly and investors’ willingness to sell increased. Additionally, the market sentiment became more cautious, and trading volume showed signs of decline.
GateNews1h ago
The “crypto pullback” wave on April 1: Is it a joke or a warning sign from within the market?
On April 1, at least five influential figures in the cryptocurrency space simultaneously posted farewell messages, declaring that they were leaving the industry permanently.
The posts quickly spread across X, creating a wave of confusion as the community couldn’t clearly tell where the serious statements ended.
TapChiBitcoin1h ago
Bitcoin, stocks soar as markets respond to chance of US and Israel-Iran war ending
Bitcoin (BTC) briefly jumped to $68,589, and US stock markets rallied as investors reacted to US President Donald Trump's statements on considering options for ending the US and Israel-Iran war. Separate, unconfirmed comments attributed to Iranian President Masoud Pezeshkian also suggested that Iran
Cointelegraph1h ago
Gate Daily Report (April 2): The U.S. Department of the Treasury releases a notice of proposed rules for the “GENIUS Act”; the CFTC says it is prepared to regulate the entire crypto market
Bitcoin (BTC) dipped in the short term to $67,600. The U.S. Department of the Treasury launched a small consultation on regulatory guidance for stablecoins under the “GENIUS Act,” and the CFTC Chair said he is ready to regulate the entire crypto market. Amid market developments, spot Bitcoin inflows are slightly higher than outflows, and the CFTC and the SEC have signed an agreement to coordinate digital asset regulation.
MarketWhisper1h ago
