
Key Takeaways
-
SAND price is showing early signs of stabilization after recent downside pressure.
-
Buyers appear to be defending a key support zone, hinting at a potential short-term rebound.
-
A breakout above nearby resistance could open the door for a stronger recovery move.
Gaming-focused crypto tokens are back in the spotlight after Axie Infinity (AXS) posted a sharp rally of over 16% in a single day and more than 246% over the past month, reigniting optimism around the gaming narrative. Riding this renewed momentum, Sandbox (SAND) has also stepped into focus, climbing nearly 45% as overall market sentiment turns constructive.
Beyond the recent price bounce, the technical structure on the chart is starting to tell a bigger story, hinting that SAND may be setting up for a bullish continuation move.
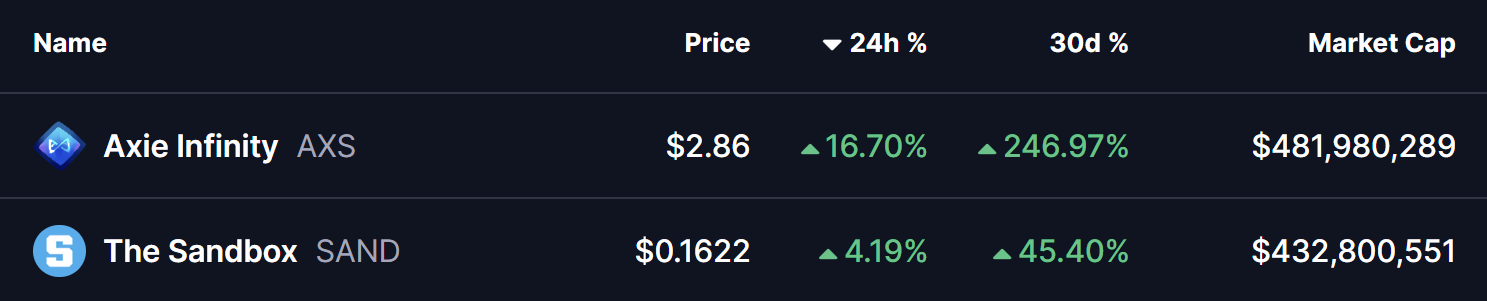
Source: Coinmarketcap
Descending Broadening Wedge Pattern in Play
On the daily timeframe, SAND is trading within a descending broadening wedge — a bullish reversal pattern that often develops during corrective phases before a trend shift. This structure reflects increasing volatility, with price gradually compressing while buyers quietly regain control.
During the latest pullback, SAND successfully retested the lower boundary of the wedge near the $0.11 zone, an area that has repeatedly acted as strong demand. Buyers stepped in aggressively at this level, triggering a rebound that pushed price toward $0.1711, placing SAND right near the wedge’s upper resistance trendline.
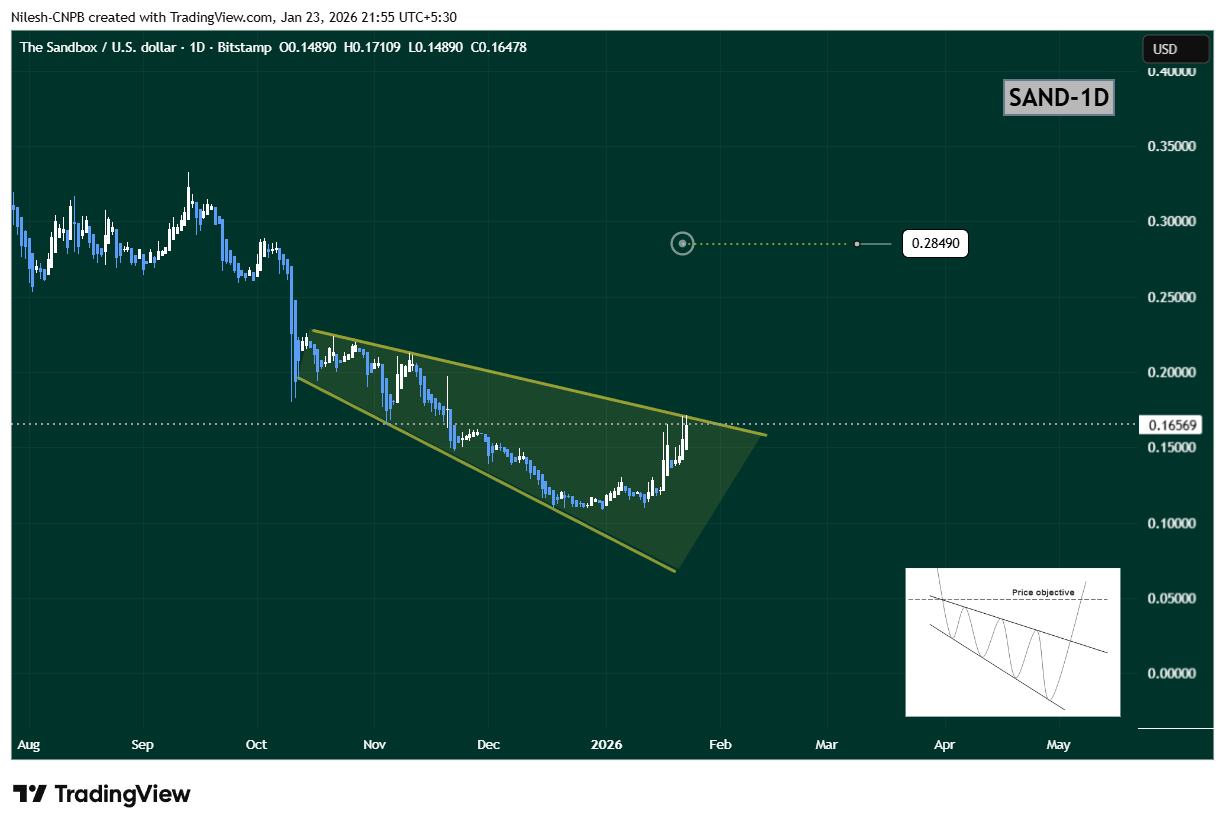
Sandbox (SAND) Daily Chart/Coinsprobe (Source: Tradingview)
The steady rise toward this upper boundary suggests growing bullish momentum and increasing breakout pressure.
What’s Next for SAND?
If buyers manage to push SAND above the upper wedge resistance near $0.1711, it would confirm a bullish breakout from the pattern. In that scenario, the chart opens the door for a move toward the $0.2849 target, which aligns with the measured move of the wedge and represents roughly 73% upside from current levels.
However, if price faces rejection at resistance, SAND could continue consolidating within the wedge structure. In that case, the $0.13–$0.14 region will act as an important short-term support zone to watch.
Bottom Line
SAND’s overall technical structure remains constructive. With a bullish descending broadening wedge in play, buyers defending key support, and gaming tokens gaining renewed attention, Sandbox appears to be positioning for a potential breakout. A confirmed move above resistance could mark the beginning of a stronger upside phase in the sessions ahead.
Disclaimer: The views and analysis presented in this article are for informational purposes only and reflect the author’s perspective, not financial advice. Technical patterns and indicators discussed are subject to market volatility and may or may not yield the anticipated results. Investors are advised to exercise caution, conduct independent research, and make decisions aligned with their individual risk tolerance.
About Author: Nilesh Hembade is the Founder and Lead Author of Coinsprobe, with over 5 years of experience in the cryptocurrency and blockchain industry. Since launching Coinsprobe in 2023, he has been providing daily, research-driven insights through in-depth market analysis, on-chain data, and technical research.
Disclaimer: The information on this page may come from third parties and does not represent the views or opinions of Gate. The content displayed on this page is for reference only and does not constitute any financial, investment, or legal advice. Gate does not guarantee the accuracy or completeness of the information and shall not be liable for any losses arising from the use of this information. Virtual asset investments carry high risks and are subject to significant price volatility. You may lose all of your invested principal. Please fully understand the relevant risks and make prudent decisions based on your own financial situation and risk tolerance. For details, please refer to
Disclaimer.
Related Articles
QCP Report: Bitcoin is fluctuating around $71,000, with net on-chain funds flowing out of exchanges.
Gate News reports that on March 26, QCP released a market report. Bitcoin is currently hovering around $71,000, in a consolidation phase. The report indicates that the Middle East situation has increased geopolitical risk premiums, and on-chain data shows net outflows of funds, with capital tending to withdraw from exchanges. In the options market, implied volatility has decreased, and the curve remains slightly in contango, with some downward hedging demand. The QCP report states that, before macro and geopolitical factors become clearer, the Bitcoin market is driven by news.
GateNews1m ago
QCP: Bitcoin options volatility declines, market trends still primarily driven by news factors
Gate News reports that on March 26, the options market analysis firm QCP released a Bitcoin options market observation report. The data shows that implied volatility has slightly declined, the curve remains mildly in contango, downward hedging demand still exists but has not reached extreme levels, and geopolitical premiums continue to be reflected in volatility pricing. QCP pointed out that BTC is currently neither fully following the high-beta logic of the stock market nor has it formed stable safe-haven demand; market movements are still primarily driven by news. QCP stated that in the short term, a trending market awaits clearer macroeconomic or geopolitical developments.
GateNews2m ago
SIREN price withstands 60% correction and still hits new highs; the inverse head and shoulders pattern indicates a potential upward move.
Siren (SIREN) has increased by over 600% in the past 30 days, with the current price approaching $1.95. Technically, it maintains an inverse head and shoulders pattern, but short-term correction risks have increased. If it breaks the neckline at $2.75, the target price could exceed $4.71. Investors should monitor key support levels and price breakout developments.
GateNews5m ago
Willy Woo Updates Bitcoin Outlook: Why Bearish Trend Could Persist Through Spring - U.Today
Analyst Willy Woo noted that the Bitcoin market is experiencing deep consolidation, primarily influenced by short-term holder prices around $84,000. With current trading at $70,100, market optimism is wavering as new buyers seek to break-even, leading to a critical period for future trends.
UToday26m ago
Crypto Market Holds Near $2.43T As Investors Stay Cautious
The crypto market shows cautious stability with a $2.43T cap, a slight decrease in volume, and rising fear among participants. Bitcoin rises 0.15% while Ethereum drops 0.40%. Notable gainers include $TRUMP, $MAGA, and $CRCL. DeFi TVL increases, NFT sales plunge. Bhutan transfers $500 BTC, and Visa becomes a Super Validator for the Canton Network.
BlockChainReporter28m ago
