The charts are lining up around an important moment for the ZEC price. After weeks of sideways and choppy action, Zcash is now sitting at a level that could either support a rebound or lead to another move lower.
On the lower-timeframe chart, the ZEC price is hovering around the $360–$370 area, a zone that has acted as a pivot multiple times. This is where traders are watching closely to see if a higher low can form. Holding this range keeps the recovery structure in place, while losing it would shift attention back toward lower support zones.
- Zcash Short-Term Levels That Matter Most
- The ZEC Daily Chart Shows the Bigger Picture
- What to Watch Next for the ZEC Price
Zcash Short-Term Levels That Matter Most
The 4-hour chart shared by Sjuul gives a clean roadmap. Support sits around $360–$370, which is where the ZEC price is currently trying to hold its ground. Above that, the next major hurdle comes in near $460, a level that has capped rallies in the past.
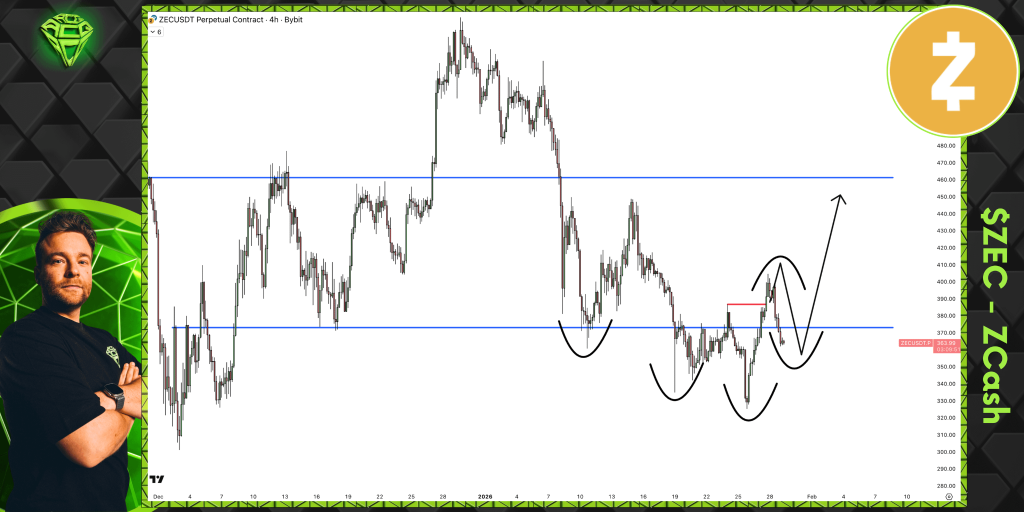
Source: X/@AltCryptoGems
There is also a clear invalidation level on the chart. A breakdown below $320 would invalidate the higher-low idea and shift the structure back toward a more bearish setup. That does not mean price is headed there, but it is the line that separates recovery from failure.
For the bullish scenario to materialize, ZEC needs to recover $370 and follow through. If so, a move to the high $300s and then testing the $460 resistance level is not entirely far-fetched.
The ZEC Daily Chart Shows the Bigger Picture
Zooming out to the daily chart shared by BitcoinCensus changes the perspective. The Zcash price has been trading within a wide bullish flag-like formation over the past months after a strong rally in the earlier stages of the cycle. The price is still trading within the flag formation. Therefore, it is likely to experience some minor corrections.
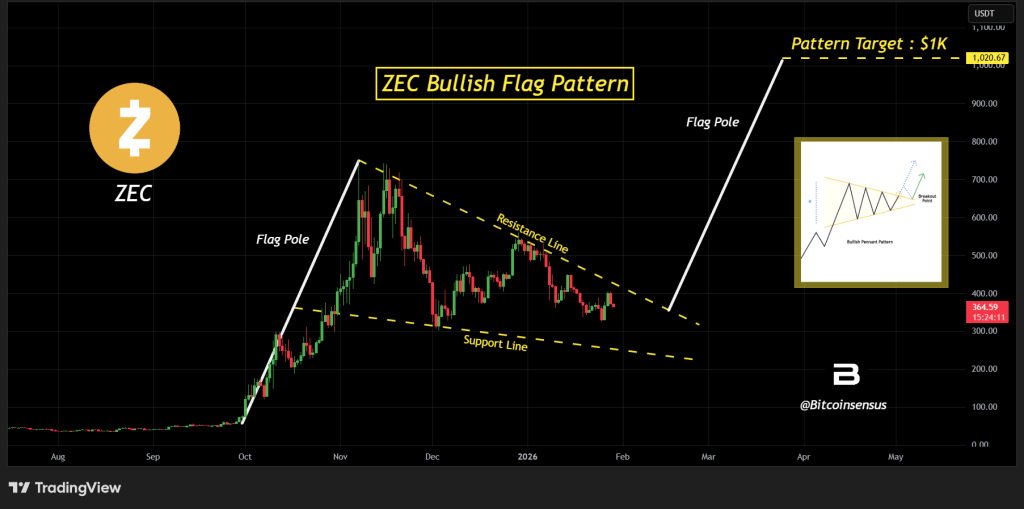
Source: X/@Bitcoinsensus
The long-term projection from this pattern points toward $1,000, but that is clearly a macro target, and not something expected in the near term.
For that scenario to even come into play, the ZEC price would need to reclaim several major resistance zones and eventually break out of the larger structure with momentum.
$KAS Price Prediction – $5,000 in Kaspa Now, How Much Could It Be Worth by 2027?_**
What to Watch Next for the ZEC Price
The big question in the short term is whether ZEC can continue to trade above the $360 to $370 level and keep the level around $320 at bay.
If that level continues to hold, the charts do indicate that ZEC could move back up towards the $400 level, perhaps facing resistance at the $460 level in the process.
Disclaimer: The information on this page may come from third parties and does not represent the views or opinions of Gate. The content displayed on this page is for reference only and does not constitute any financial, investment, or legal advice. Gate does not guarantee the accuracy or completeness of the information and shall not be liable for any losses arising from the use of this information. Virtual asset investments carry high risks and are subject to significant price volatility. You may lose all of your invested principal. Please fully understand the relevant risks and make prudent decisions based on your own financial situation and risk tolerance. For details, please refer to
Disclaimer.
Related Articles
ETH 15-minute pump of 0.60%: exchange net capital outflows and on-chain large transfers drive a short-term rebound
2026-04-10 01:30 to 2026-04-10 01:45 (UTC), ETH traded within the 2185.0 to 2204.03 USDT range. The candlestick return was +0.60%, and the 15-minute intraday swing was 0.87%. During this period, mainstream market attention increased, with trading volume expanding by about 20% compared with the periods before and after, indicating stronger short-term liquidity.
The main drivers behind this unusual move were exchange net outflows and active on-chain large transfers. On-chain data shows that during this period, ETH saw multiple transactions, each over 8,000 ETH,
GateNews6m ago
Longtime Bitcoin whale dumps 271 million, replaying the crash scene from last January
Last week, Bitcoin whales sold about $271 million, setting the largest single-day activity since January. The market reacted well to this selloff: long-term holders significantly increased their Bitcoin holdings, indicating the market’s absorption capacity has strengthened. Analysts predict that Bitcoin could remain in the $70,000 to $72,000 range. Compared with the market conditions during the January selloff, this time has been more stable. Long-term holders’ net positions turned positive, and technical indicators suggest the market is approaching a bottom, with clear signs of a future recovery.
MarketWhisper9m ago
Why is Bitcoin up today? “Alireza” opens direct negotiations, and Trump demands that Iran “immediately” stop tanker fees
Bitcoin’s official rise today reached $71,800, mainly because Israel and Lebanon have begun direct negotiations, reducing market concerns about an Iran ceasefire agreement. In addition, a weaker US dollar and continued buying by institutional investors also pushed prices higher. On the technical side, Bitcoin’s key support levels are $68,500 to $70,000. A break above $76,000 to $78,000 could prompt another test of $80,000 to $85,000.
MarketWhisper46m ago
Gold falls to $4,758, the BTC Volatility Index drops 1.77%, and WTI crude oil rises 0.44%
April 10, gold and silver prices fell slightly, trading at $4,758.37 per ounce and $75.165 per ounce, respectively. The Bitcoin Volatility Index (BVIX) dropped to 44.36, and in the foreign exchange market, the U.S. dollar rose against the offshore yuan and the Japanese yen. Major European stock indexes generally declined, while WTI and Brent crude oil rose slightly. The Gate platform supports trading a variety of financial market products.
GateNews52m ago
Israel agrees to negotiations with Lebanon, US stocks rally, and Bitcoin briefly spikes to 73K
Israeli Prime Minister Benjamin Netanyahu agrees to hold direct negotiations with Lebanon. This news boosts gains in the U.S. stock market’s S&P 500, while oil prices fall. Bitcoin’s price briefly rose to 73K; market sentiment improved slightly, but overall it has not fully rebounded. Trump urged Iran to stop its attacks to facilitate negotiations, but shipping through the strait has not improved yet.
ChainNewsAbmedia2h ago
BTC 15-minute drop of 0.42%: Large-amount net outflows and geopolitical risk-off sentiment weigh on the short-term market
From 22:30 to 22:45 (UTC) on 2026-04-09, the BTC price briefly dipped within a 0.46% amplitude range. The return was recorded at -0.42%, and the price fluctuated between 72,298.3 and 72,631.6 USDT.
During this period, market attention warmed up. Trading volume for short-term active orders increased alongside heightened volatility, and overall sentiment turned cautious.
The main driving forces behind this unusual move were net outflows of large exchange funds and a liquidity bottleneck. On-chain data shows that over the past 24 hours, the BTC exchange large-net-outflow amount reached -559.08 BTC, directly reflecting institutions and Large Investors
GateNews3h ago
