
Key Takeaways
-
SAND price is showing early signs of stabilization after recent downside pressure.
-
Buyers appear to be defending a key support zone, hinting at a potential short-term rebound.
-
A breakout above nearby resistance could open the door for a stronger recovery move.
Gaming-focused crypto tokens are back in the spotlight after Axie Infinity (AXS) posted a sharp rally of over 16% in a single day and more than 246% over the past month, reigniting optimism around the gaming narrative. Riding this renewed momentum, Sandbox (SAND) has also stepped into focus, climbing nearly 45% as overall market sentiment turns constructive.
Beyond the recent price bounce, the technical structure on the chart is starting to tell a bigger story, hinting that SAND may be setting up for a bullish continuation move.
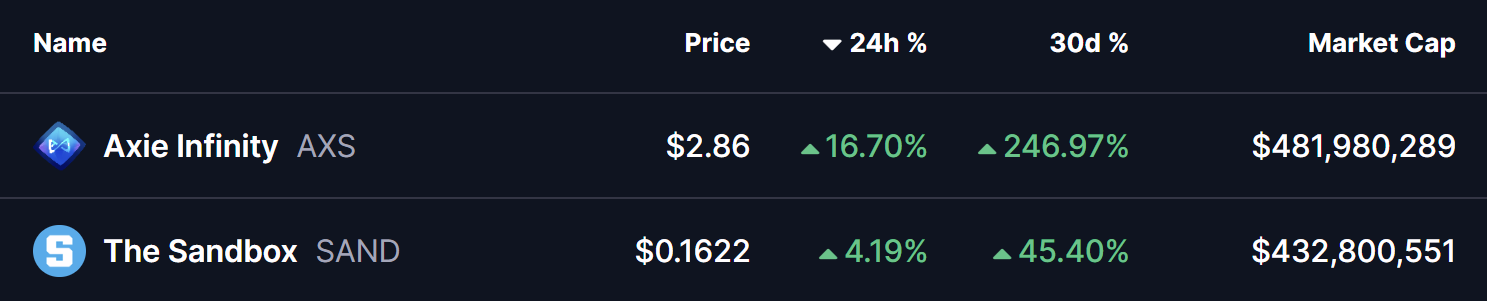
Source: Coinmarketcap
Descending Broadening Wedge Pattern in Play
On the daily timeframe, SAND is trading within a descending broadening wedge — a bullish reversal pattern that often develops during corrective phases before a trend shift. This structure reflects increasing volatility, with price gradually compressing while buyers quietly regain control.
During the latest pullback, SAND successfully retested the lower boundary of the wedge near the $0.11 zone, an area that has repeatedly acted as strong demand. Buyers stepped in aggressively at this level, triggering a rebound that pushed price toward $0.1711, placing SAND right near the wedge’s upper resistance trendline.
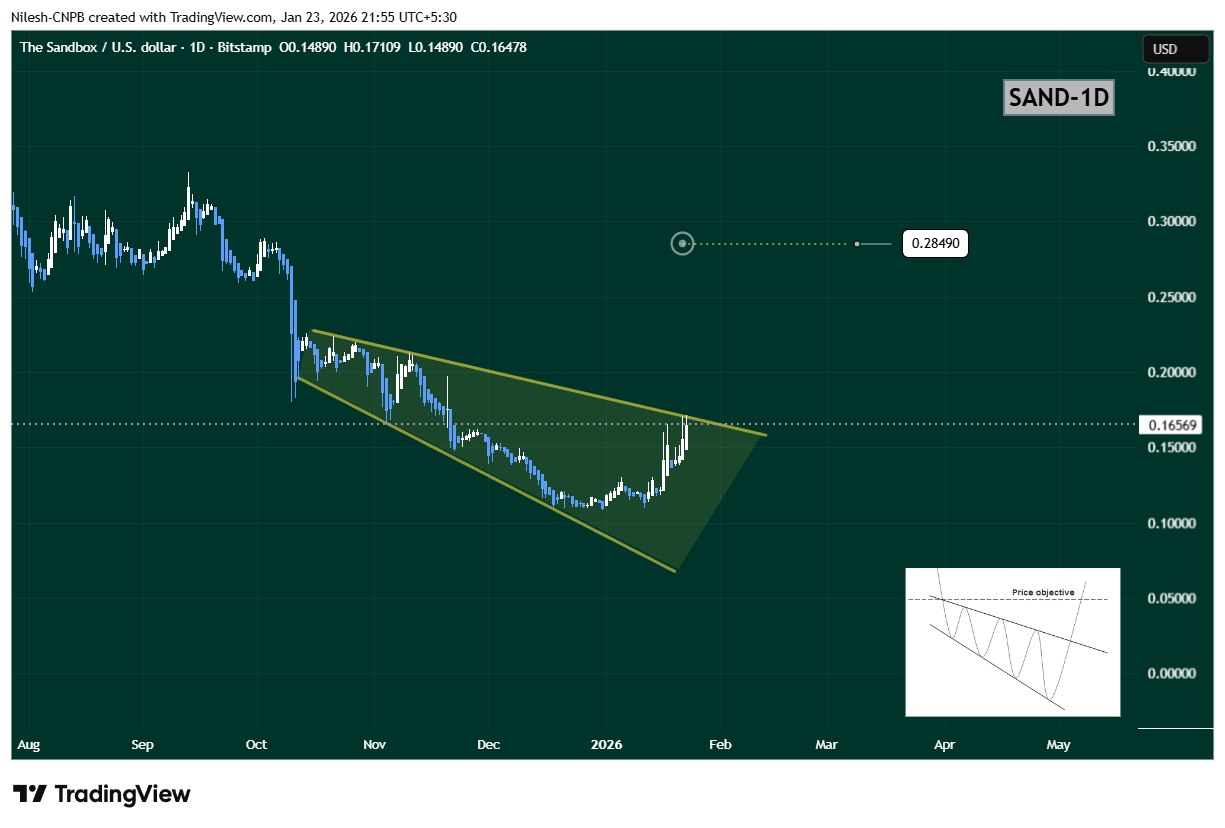
Sandbox (SAND) Daily Chart/Coinsprobe (Source: Tradingview)
The steady rise toward this upper boundary suggests growing bullish momentum and increasing breakout pressure.
What’s Next for SAND?
If buyers manage to push SAND above the upper wedge resistance near $0.1711, it would confirm a bullish breakout from the pattern. In that scenario, the chart opens the door for a move toward the $0.2849 target, which aligns with the measured move of the wedge and represents roughly 73% upside from current levels.
However, if price faces rejection at resistance, SAND could continue consolidating within the wedge structure. In that case, the $0.13–$0.14 region will act as an important short-term support zone to watch.
Bottom Line
SAND’s overall technical structure remains constructive. With a bullish descending broadening wedge in play, buyers defending key support, and gaming tokens gaining renewed attention, Sandbox appears to be positioning for a potential breakout. A confirmed move above resistance could mark the beginning of a stronger upside phase in the sessions ahead.
Disclaimer: The views and analysis presented in this article are for informational purposes only and reflect the author’s perspective, not financial advice. Technical patterns and indicators discussed are subject to market volatility and may or may not yield the anticipated results. Investors are advised to exercise caution, conduct independent research, and make decisions aligned with their individual risk tolerance.
About Author: Nilesh Hembade is the Founder and Lead Author of Coinsprobe, with over 5 years of experience in the cryptocurrency and blockchain industry. Since launching Coinsprobe in 2023, he has been providing daily, research-driven insights through in-depth market analysis, on-chain data, and technical research.
Disclaimer: The information on this page may come from third parties and does not represent the views or opinions of Gate. The content displayed on this page is for reference only and does not constitute any financial, investment, or legal advice. Gate does not guarantee the accuracy or completeness of the information and shall not be liable for any losses arising from the use of this information. Virtual asset investments carry high risks and are subject to significant price volatility. You may lose all of your invested principal. Please fully understand the relevant risks and make prudent decisions based on your own financial situation and risk tolerance. For details, please refer to
Disclaimer.
Related Articles
BTC 15-minute rise 0.48%: stronger spot buy-side demand combined with shrinking liquidity driving the move
2026-04-13 14:30 to 2026-04-13 14:45 (UTC), BTC saw a +0.48% return within a 0.55% amplitude range (71600.7–71997.0 USDT). During this period, market volatility increased; both spot and on-chain data indicate that short-term capital flows were notably active, market attention rose, and sentiment remains cautious.
The main driver behind this deviation is stronger spot-market buy pressure and the continued net outflow of exchange funds. Specifically, over the past 24 hours, BTC spot trading volume was about $33.15B, compared with the 7-day average
GateNews42m ago
Bitmine gets promoted to the NYSE main board! Tom Lee: US stocks may be at their bottom, and selling pressure on Ether could ease
Bitmine has officially transferred from the NYSE American board to the main board in the United States, marking an important milestone for the company. Despite a significant drop in its share price, it has still increased the share repurchase plan amount to $4.0 billion. The company holds a large amount of Ether, and it expects that a rebound in the crypto market will help improve its assets and share price performance.
CryptoCity48m ago
Gold and silver fall across the board, and the BTC/ETH volatility index rises slightly
On April 13, gold and silver prices fell to $4,732.92 per ounce and $74.209 per ounce, respectively. The BTC volatility index rose by 0.42%, and the ETH volatility index rose by 0.31%. The U.S. dollar versus the Chinese yuan and the Japanese yen edged up slightly, major European stock indexes generally fell, while WTI and Brent crude oil prices rose. The Gate platform supports trading for multiple asset types.
GateNews1h ago
ETH 15-minute rise of 1.24%: On-chain capital outflows and macro risk aversion converge to boost volatility
From 2026-04-13 13:45 to 14:00 (UTC), ETH surged rapidly within a 1.48% amplitude. The price ranged from 2182.61 to 2214.98 USDT, and the return rate in 15 minutes reached +1.24%. This bout of unusual activity has drawn market attention, with active capital inflows and outflows, a marked increase in volatility, and a short-term warming of trading sentiment.
The main driver behind this unusual activity is on-chain capital outflows and changes in the holdings structure. Over the past few weeks, the net positions of the 1k–10k ETH whale cohort and the 10k+ super whale cohort have continued to decline, around April 13, the related
GateNews1h ago
Bitcoin retreats to $71k, spot ETF net inflows of nearly $1 billion last week
Bitcoin and Ethereum prices were holding steady around April 13, and the overall crypto market weakened. Oil prices rebounded, influenced by the situation in the Middle East. Bitcoin ETF funds worth nearly $1 billion flowed in, but addresses still in unrealized losses remain in the majority, and open interest in futures contracts fell significantly.
GateNews1h ago
Bitcoin’s Bearish Breakdown Signifies Collapse of Futures-Led Rally
Bitcoin is experiencing significant volatility following a futures-driven market rally that has collapsed, leading to major price corrections and a drop in Open Interest. The market is now vulnerable to further downturns due to a lack of spot demand, indicating structural weaknesses.
BlockChainReporter2h ago
