The price of Zcash (ZEC) continues to sink in the red as it trades below the $366 mark on Thursday, after an unsuccessful attempt to break above the broken trendline from previous days. Signals from on-chain data and derivatives market reflect a clear polarization in trader sentiment, further restraining the recovery of the price.
Contrasting Sentiments Limit the Recovery
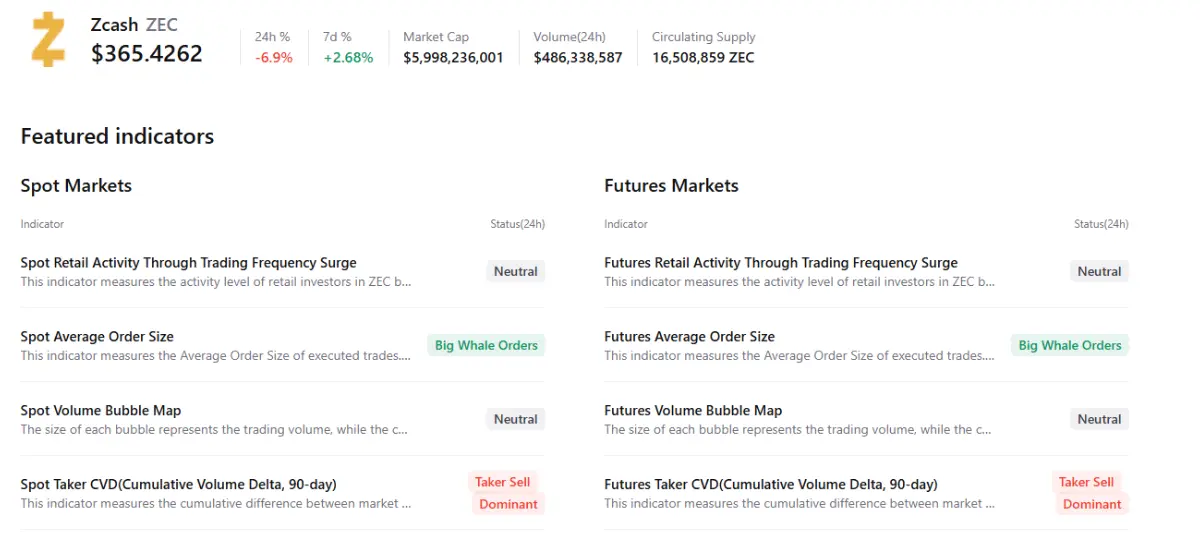
Aggregated data from CryptoQuant shows that trader sentiment for Zcash is in a state of indecision. Although large-volume orders from whales appear in both spot and futures markets—indicating bullish interest—rising selling pressure and dominance suggest that supply remains high. The interplay between these two extremes reflects cautious, hesitant investor psychology, thereby reducing the likelihood of a sustainable rebound.
In the derivatives market, the picture is equally cautious. Data from CoinGlass indicates that the ZEC funding rate turned positive from Wednesday and increased to 0.0091% on Thursday, meaning long positions are paying fees to short positions—a somewhat optimistic signal.
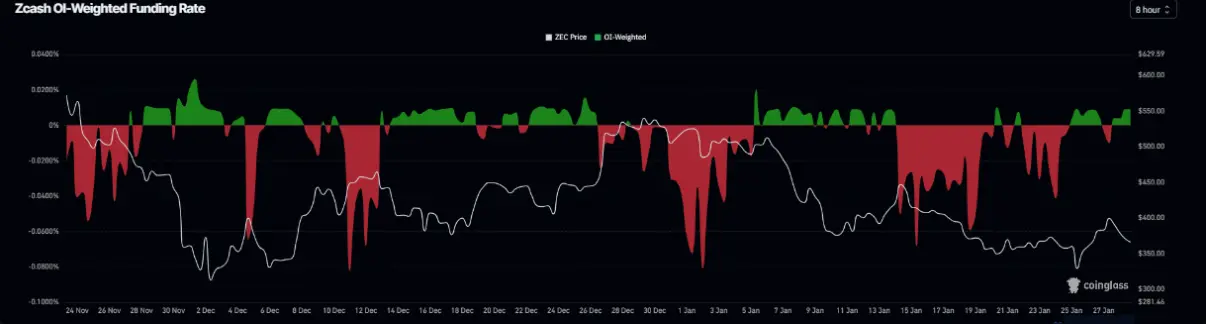 ZEC Funding Rate Chart | Source: CoinglassHowever, the long/short ratio has decreased to 0.94, indicating that bearish bets are increasing. This divergence highlights growing uncertainty in the derivatives market and continues to erode confidence in a clear upward trend.
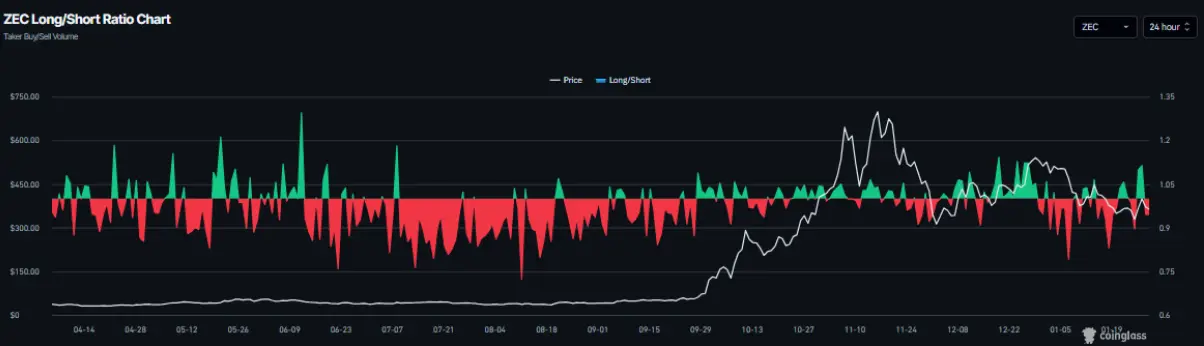 ZEC Long/Short Ratio | Source: Coinglass## Zcash Price Forecast: ZEC Faces Rejection at Key Levels
From a technical perspective, ZEC’s short-term outlook remains bearish. The coin started the week relatively positively, rising about 21% until Tuesday and testing the previous upward trendline that was broken—formed by connecting lows since October.
However, the recovery quickly stalled. On Wednesday, ZEC failed to break through this critical resistance zone and reversed down 7.2%. This is considered a very strong “resistance cluster,” as it converges several key technical factors, including the old trendline, the 50-day exponential moving average (EMA) at $411.08, the Point of Control (POC)—the price level with the highest trading volume since mid-October—and the 61.8% Fibonacci retracement level around $400.02.
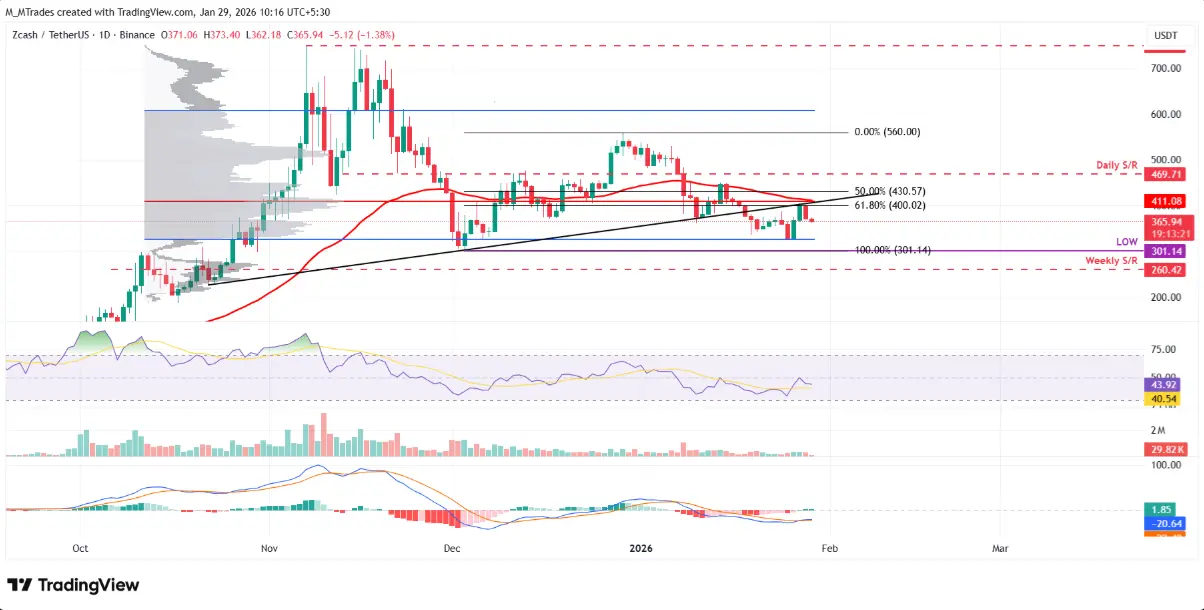 Daily ZEC/USDT Chart | Source: TradingView If selling pressure persists, ZEC could extend its correction toward Sunday’s low of $325. Closing below this support level is likely to open the door to deeper declines, targeting the December 3rd low at $301.14.
Momentum indicators also support the bearish scenario. The Relative Strength Index (RSI) is currently at 43, below the neutral threshold of 50, indicating that the bears are gradually gaining control. Meanwhile, MACD lines show signs of convergence, and the green histogram above the centerline is shrinking, reflecting a clear weakening of the upward momentum.
Conversely, if ZEC regains momentum and successfully closes above the 50-day EMA at $411.08 on the daily timeframe, the price could continue upward toward the 50% Fibonacci retracement level at $430.57.
SN_Nour
Disclaimer: The information on this page may come from third parties and does not represent the views or opinions of Gate. The content displayed on this page is for reference only and does not constitute any financial, investment, or legal advice. Gate does not guarantee the accuracy or completeness of the information and shall not be liable for any losses arising from the use of this information. Virtual asset investments carry high risks and are subject to significant price volatility. You may lose all of your invested principal. Please fully understand the relevant risks and make prudent decisions based on your own financial situation and risk tolerance. For details, please refer to
Disclaimer.
Related Articles
Bitmine gets promoted to the NYSE main board! Tom Lee: US stocks may have bottomed out, and sell pressure on Ether could ease
Bitmine has officially moved from the NYSE American board to the main board, marking an important milestone for the company. Despite the sharp decline in its share price, it has still increased the share repurchase plan amount to $4 billion. The company holds a large amount of Ethereum, and it expects that a rebound in the crypto market will help boost its assets and share price performance.
CryptoCity3h ago
Why Is Bitcoin Up Today? Hormuz Blockade Triggers Short Squeeze and a BTC Test of $75k
On April 13, Bitcoin rose from its early-session low of 70,741 to trade as high as $74,900 during the session, approaching the $75,000 level. The main drivers came from two directions: after Trump ordered the blockade of the Strait of Hormuz, traders began to view Bitcoin as a geopolitical hedge asset; and a massive net short position that had been building as funding rates stayed persistently negative was met with liquidation, triggering a chain of liquidations totaling millions of dollars near the $70,000 support level.
MarketWhisper4h ago
Bitmine gets promoted to the NYSE main board! Tom Lee: U.S. stocks may have bottomed out, and Ether’s selling pressure may ease
Bitmine has officially moved from the NYSE American board to the main board in the United States, marking an important milestone for the company. Despite a sharp drop in its stock price, it has still increased its share repurchase authorization to $4.0 billion. The company holds a large amount of Ether, and it predicts that a rebound in the crypto market will help boost its assets and stock price performance.
CryptoCity6h ago
U.S. stocks have recovered the losses since the Iran war, while Bitcoin pushes up to 74K
Due to market expectations that the United States and Iran will reach an agreement, the S&P 500 index has rebounded to its highest level since the war, and Bitcoin has also surged to $74,900. Despite the failure of peace talks between the U.S. and Iran, the U.S. has imposed a maritime blockade to pressure Iran. MicroStrategy once again made a large-scale purchase of Bitcoin, indicating that investor confidence is picking up.
ChainNewsAbmedia6h ago
BTC 15-minute surge up 0.77%: Spot buy-side demand and on-chain activity convergence drive short-term strength
2026-04-13 22:00 to 2026-04-13 22:15 (UTC), the BTC price fluctuated upward within 15 minutes, with a return of +0.77%. The high and low prices in the range were between 73178.0 and 73899.0 USDT, and the amplitude was 0.99%. During the event, market attention increased, volatility slightly intensified, and overall sentiment leaned positive.
The main driver behind this price deviation was active spot market buy orders stepping in, which pushed the BTC price higher in the short term. The number of active addresses on-chain remained at a high level, reflecting an increase in genuine trading demand. Trading volume was higher than in the previous period,
GateNews7h ago
