The bearish forces are trying to keep Bitcoin (BTC) below the $90,500 mark, but buying pressure continues to increase, creating significant pressure on the market. On CNBC, Tom Lee – managing partner of Fundstrat – stated that cryptocurrencies tend to benefit in a weakening USD environment. However, current trading flows are still primarily flowing into gold and silver. According to Mr. Lee, cryptocurrencies are likely to “catch up” with this upward trend as the rally of precious metals gradually cools down.
Santiment analytics platform reported on social media that, for most of this month, discussions about gold and silver have dominated over cryptocurrencies. This indicates that retail investors are flexibly rotating their capital into leading assets in the current bullish trend.
However, the bulls still have reasons to remain optimistic. Data from Coinglass shows that since 2013, February has only seen three instances of BTC price declines, with a median increase of up to 12.21%. If history repeats, Bitcoin is likely to enter a new bullish phase in February.
So, is the buying power strong enough to push BTC and major altcoins through key resistance zones? Let’s analyze the charts of the top 10 cryptocurrencies to find out.
Technical Analysis of BTC
BTC’s recent rally has touched moving averages, where bears are expected to create strong resistance.
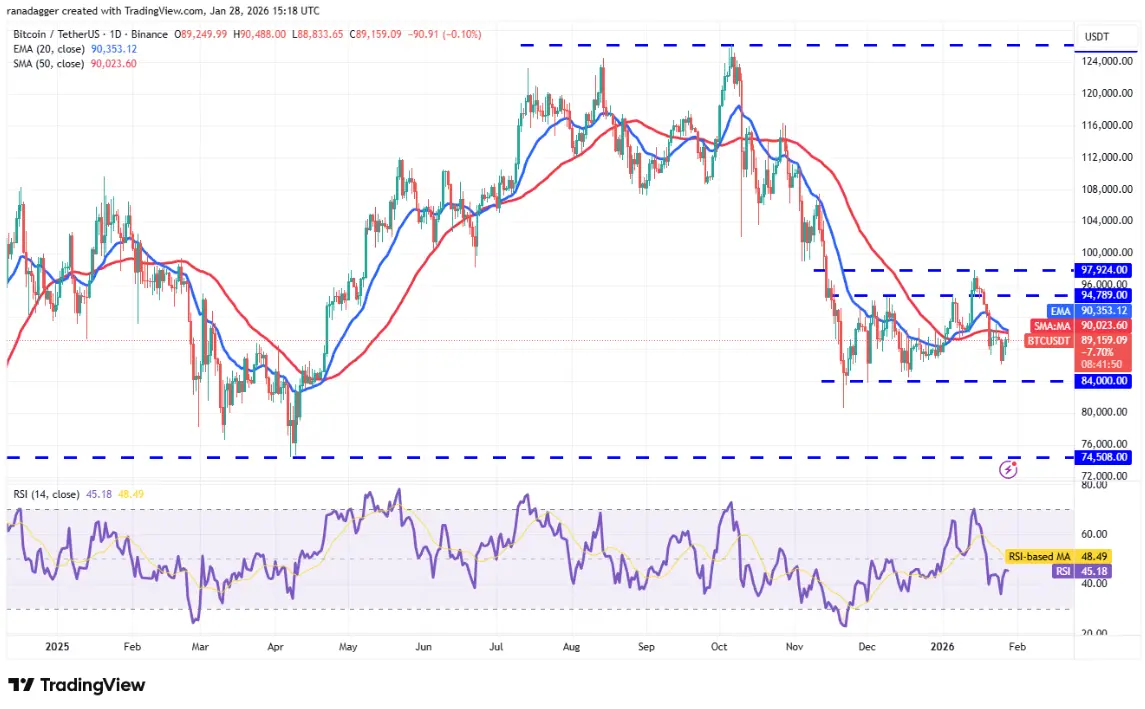 Daily BTC/USDT Chart | Source: TradingView If the price turns down from these moving averages, the BTC/USDT pair could decline to the support zone at $84,000. Buyers are expected to strongly defend this level, because a close below $84,000 could cause Bitcoin’s price to plunge to $80,600, or even to the strong support zone at $74,508.
Conversely, a break and close above the moving averages will open up the possibility of a rally toward the resistance zone of $94,789 – $97,924. A close above this zone would signal that the correction phase may have ended.
Technical Analysis of ETH
Ether (ETH) returned to the symmetrical triangle pattern on Tuesday, but the recovery is facing resistance at the moving averages.
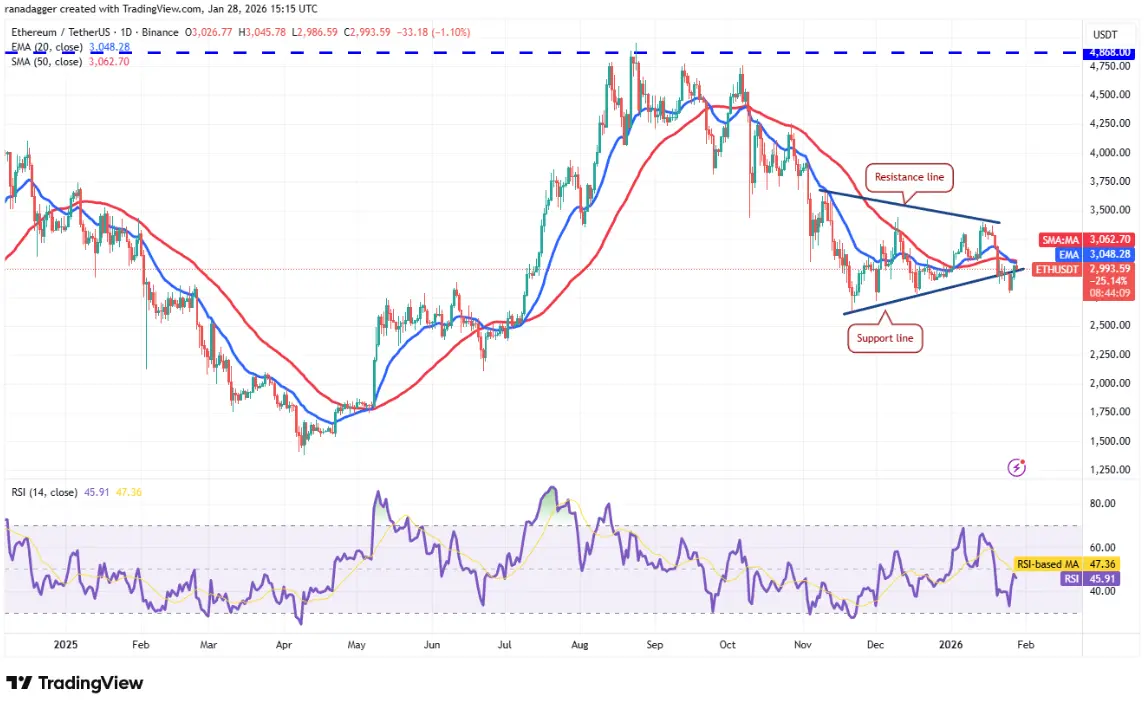 Daily ETH/USDT Chart | Source: TradingView If the price drops sharply from this area, the bears will try to pull ETH/USDT below $2,787. In that case, Ether’s price could fall sharply to $2,623.
On the other hand, a close above the moving averages indicates that the market has rejected the breakdown below the support line. This improves the chances of a breakout above the resistance line, pushing the price toward $3,659.
Technical Analysis of BNB
BNB is attempting to rise above the 20-day EMA (897 USD), indicating that demand is emerging at lower levels.
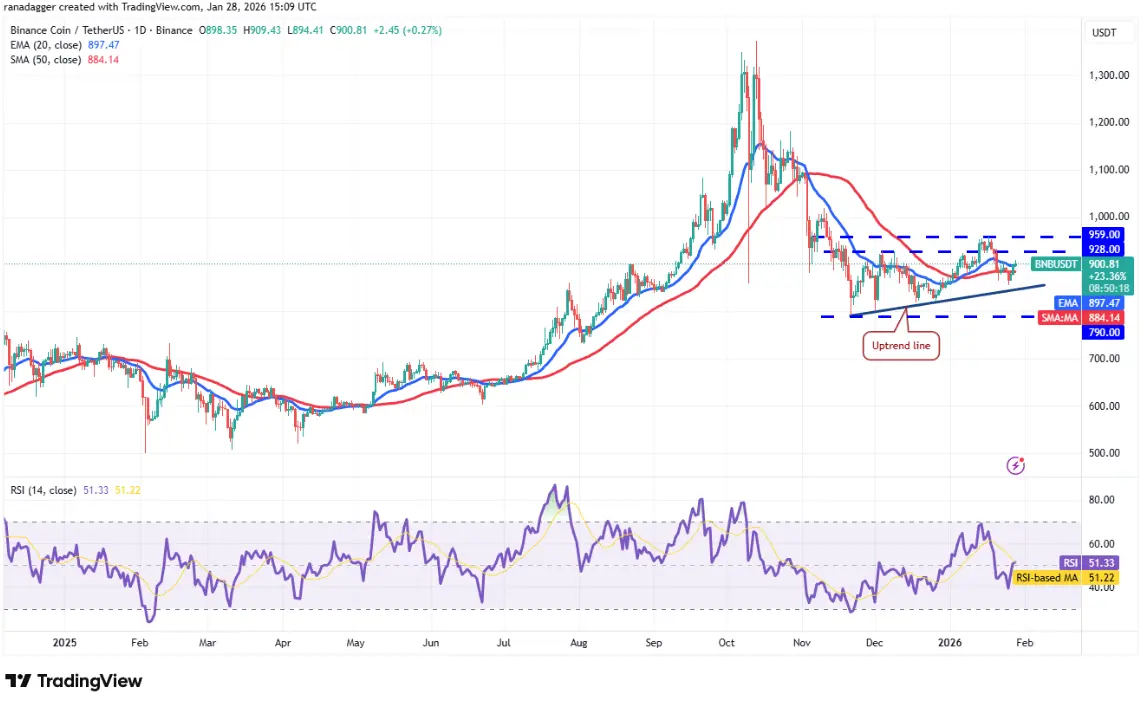 Daily BNB/USDT Chart | Source: TradingView The BNB/USDT pair could move up to the resistance zone of $928 – $959, where bears are expected to defend aggressively. If buyers manage to conquer this area, BNB’s price could start a new rally toward $1,020.
On the other hand, bears need to pull the price below the upward trendline to gain an advantage. If successful, the pair could slide back to the support zone of $790. Bulls are expected to strongly defend this level, because a close below $790 could resume the downtrend.
Technical Analysis of XRP
Buyers are trying to push XRP above the moving averages, but bears are still holding their ground.
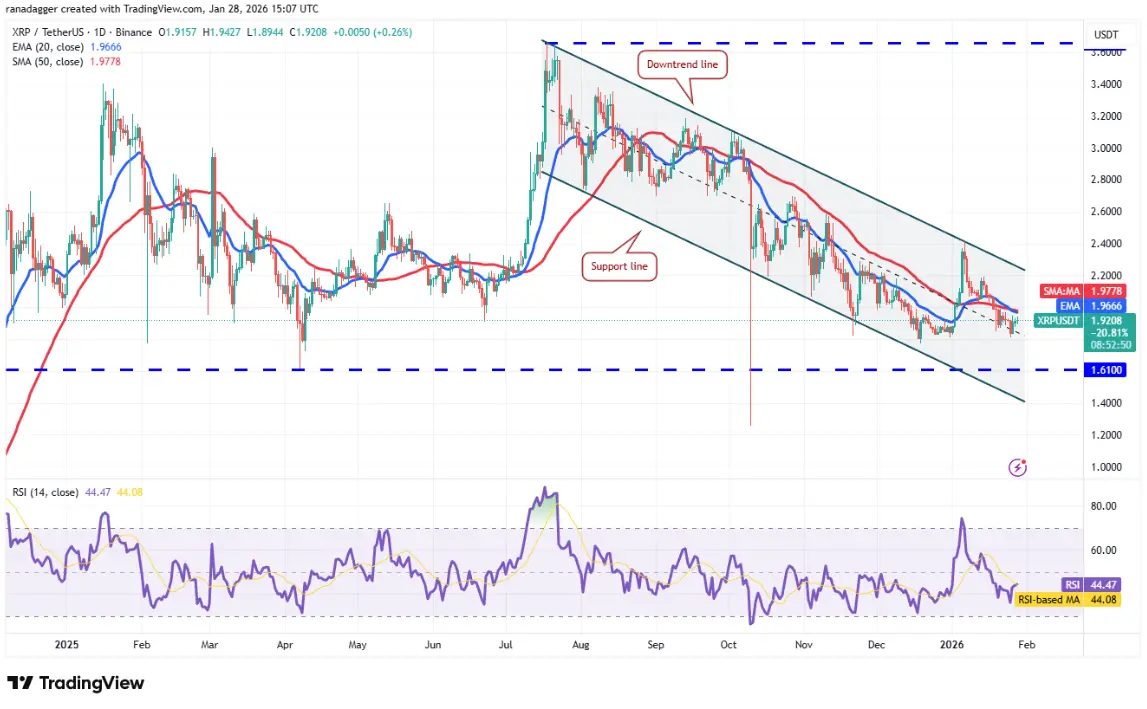 Daily XRP/USDT Chart | Source: TradingView Bears will attempt to pull XRP below $1.77. If successful, the XRP/USDT pair could decline to the important support zone at $1.61. Buyers are expected to defend the area between the descending channel support line and the $1.61 mark.
If the price rises above the moving averages, the pair could move toward the downtrend line. A close above this line would signal the start of a new bullish trend.
Technical Analysis of SOL
Solana (SOL) rebounded from the support zone of $117 on Monday, but the recovery is likely to face selling pressure at the moving averages.
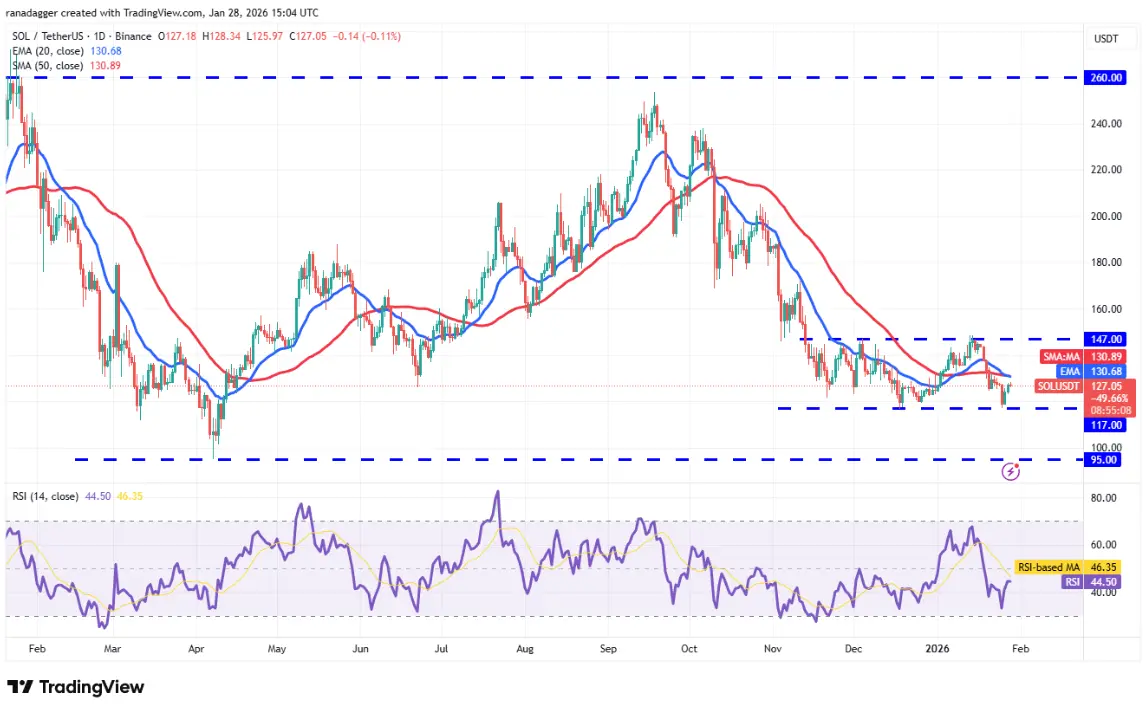 Daily SOL/USDT Chart | Source: TradingView If the price turns down from here, bears will continue to try to push SOL/USDT below $117. In that case, SOL’s price could plunge toward the strong support zone at $95.
Conversely, a breakout above the moving averages will open the door for a rally toward the resistance zone of $147. Buyers need to clear this hurdle to confirm that the correction phase has ended.
Technical Analysis of DOGE
Dogecoin (DOGE) has bounced from the support zone of $0.12, but the recovery is expected to face selling pressure at the moving averages.
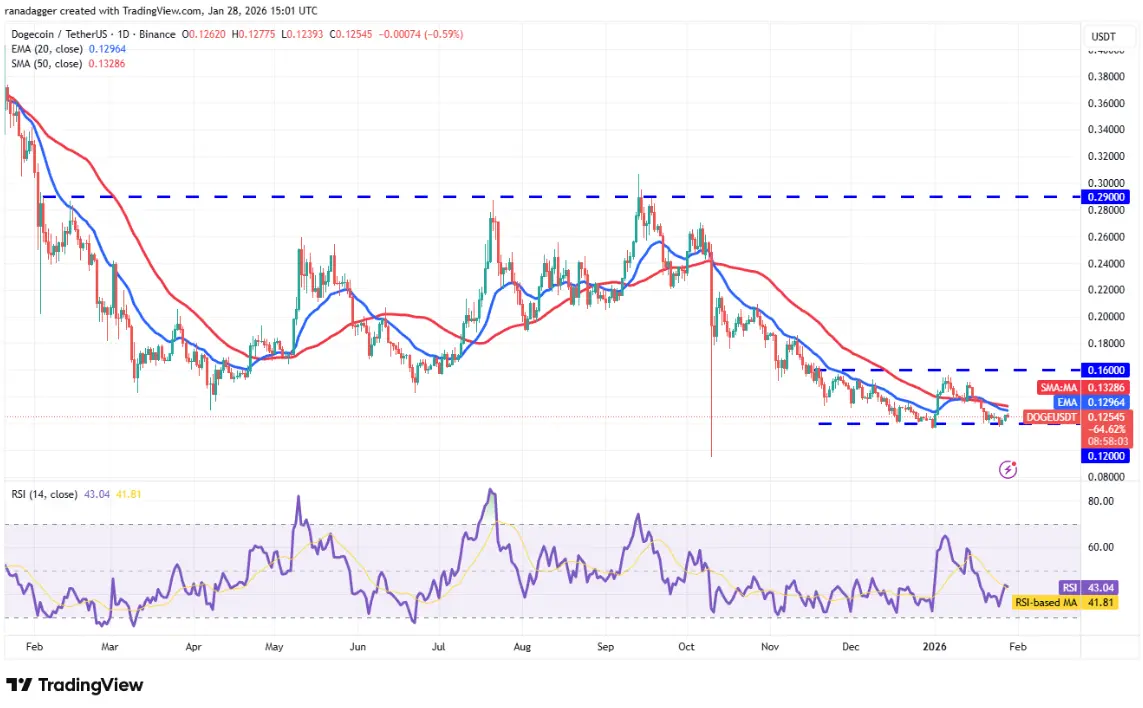 Daily DOGE/USDT Chart | Source: TradingView If the price drops sharply from here, the risk of breaking below $0.12 increases. In that case, DOGE/USDT could fall to the October 10, 2025, low of $0.10.
On the other hand, a break and close above the moving averages indicate that the price may trade sideways in the short term. Dogecoin could fluctuate within the $0.12 – $0.16 range for some time. A close above $0.16 would signal a short-term trend reversal.
Disclaimer: The information on this page may come from third parties and does not represent the views or opinions of Gate. The content displayed on this page is for reference only and does not constitute any financial, investment, or legal advice. Gate does not guarantee the accuracy or completeness of the information and shall not be liable for any losses arising from the use of this information. Virtual asset investments carry high risks and are subject to significant price volatility. You may lose all of your invested principal. Please fully understand the relevant risks and make prudent decisions based on your own financial situation and risk tolerance. For details, please refer to
Disclaimer.
