
Key Takeaways
-
SKY is forming a rounding bottom pattern on the daily chart
-
Price has rebounded strongly from the $0.0419 demand zone
-
Rising volume supports improving bullish momentum
-
A breakout above $0.0778 could confirm trend reversal
-
Pattern projection points toward the $0.11 region
Sky (SKY), the native governance and utility token of the Sky Protocol (formerly MakerDAO), has stepped into the spotlight after posting a strong daily move of over 8%, accompanied by a sharp 35% surge in trading volume. While the short-term momentum is drawing attention, the more compelling story is unfolding on the higher timeframe chart.
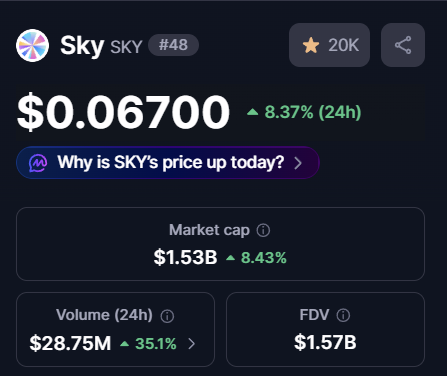
Source: Coinmarketcap
Price action is now forming a classic bullish reversal structure — one that often signals the transition from prolonged weakness into a new recovery phase.
Rounding Bottom Pattern Signals Trend Shift
On the daily timeframe, SKY appears to be completing a rounding bottom formation, a well-known bullish reversal pattern that typically develops after extended downtrends. This structure reflects a gradual shift in market psychology, where persistent selling pressure slowly fades and long-term accumulation begins to dominate.
Earlier in the trend, SKY faced repeated rejection near the $0.0778 neckline resistance, which triggered a steep sell-off. That decline ultimately bottomed near $0.0419, marking a critical demand zone where buyers aggressively stepped in and prevented further downside.
Since establishing this low, price action has steadily curved higher, forming a smooth rounded base. This gradual recovery — rather than a sharp V-shaped bounce — suggests healthier accumulation rather than short-term speculation.
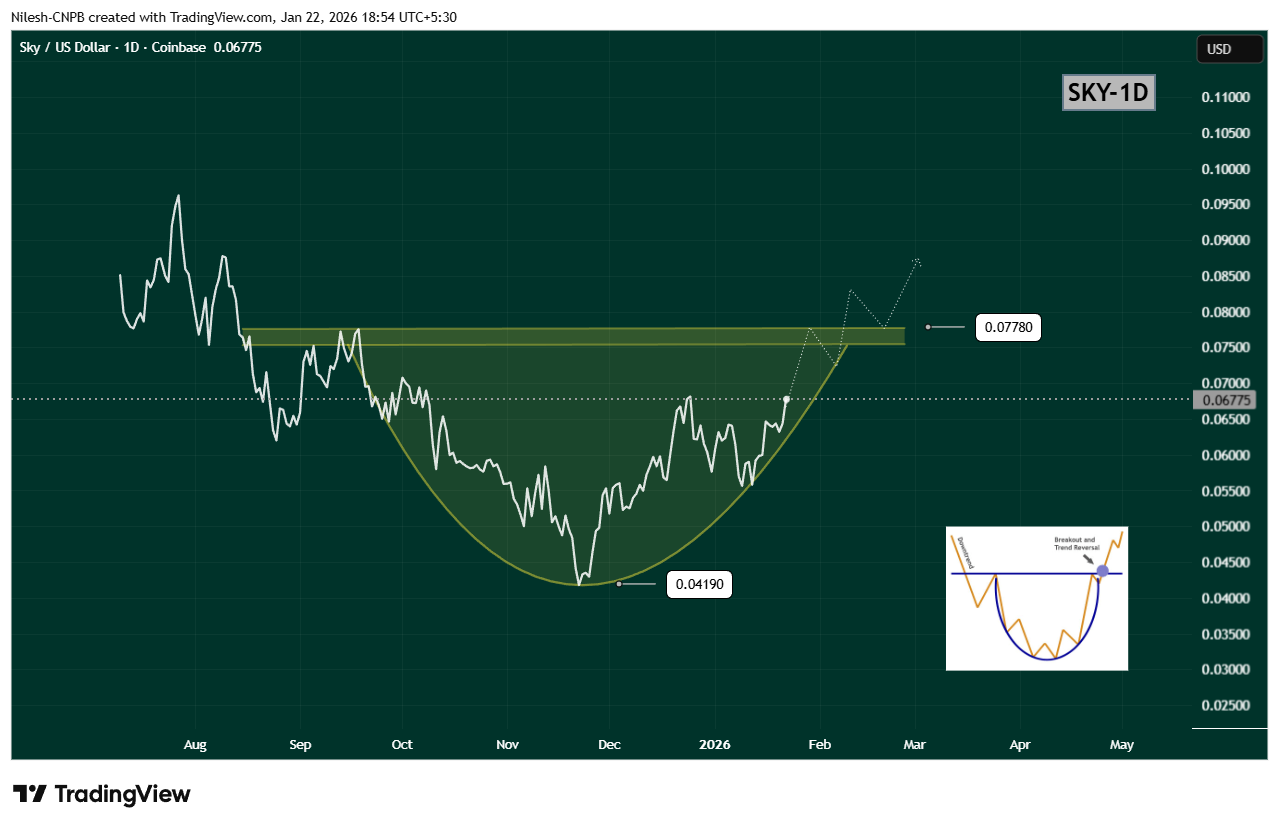
$SKY Daily Chart/Coinsprobe (Source: Tradingview)
Breakout Zone Comes Into Focus
Recent price action shows SKY reclaiming the $0.06933 region, a level that previously acted as resistance. This move strengthens the bullish structure and signals that buyers are gaining confidence ahead of a potential neckline test.
The key level to watch now is the $0.0778 resistance zone. A decisive daily close above this level would confirm the rounding bottom breakout and mark a clear shift in trend structure. Ideally, a breakout followed by a successful retest of this zone as support would further validate the bullish case.
Upside Projection and Risk Outlook
Based on the depth of the rounding bottom, the measured upside projection points toward the $0.11 region. Reaching this target would represent a potential 60–65% upside from current levels, aligning well with historical behavior of similar reversal patterns.
That said, patience remains important. Before any confirmed breakout, SKY could still experience short-term pullbacks or consolidation near the rising curve of the pattern. Such moves would not invalidate the bullish setup, as long as price continues to hold above recent higher lows.
A breakdown below the rounding base would weaken the structure, but for now, momentum favors the bulls.
Bottom Line
SKY is showing clear signs of a trend reversal in progress, with a rounding bottom pattern taking shape on the daily chart. Rising volume, improving structure, and a steady recovery toward neckline resistance all suggest that accumulation is underway.
If SKY can break and hold above $0.0778, the path opens toward the $0.11 region, signaling a broader bullish continuation. Until then, consolidation and minor pullbacks remain possible — but the overall structure is one that traders will be watching closely.
Disclaimer: The views and analysis presented in this article are for informational purposes only and reflect the author’s perspective, not financial advice. Technical patterns and indicators discussed are subject to market volatility and may or may not yield the anticipated results. Investors are advised to exercise caution, conduct independent research, and make decisions aligned with their individual risk tolerance.
About Author: Nilesh Hembade is the Founder and Lead Author of Coinsprobe, with over 5 years of experience in the cryptocurrency and blockchain industry. Since launching Coinsprobe in 2023, he has been providing daily, research-driven insights through in-depth market analysis, on-chain data, and technical research.
Disclaimer: The information on this page may come from third parties and does not represent the views or opinions of Gate. The content displayed on this page is for reference only and does not constitute any financial, investment, or legal advice. Gate does not guarantee the accuracy or completeness of the information and shall not be liable for any losses arising from the use of this information. Virtual asset investments carry high risks and are subject to significant price volatility. You may lose all of your invested principal. Please fully understand the relevant risks and make prudent decisions based on your own financial situation and risk tolerance. For details, please refer to
Disclaimer.
Related Articles
William Blair: After a certain CEX callback, risk is released, and prospects are boosted by USDC growth
Investment bank William Blair said that after a decline in its stock price in the first quarter, a certain CEX has already completed risk clearing, and the market has fully priced in expectations of weak trading volume and revenue. Although the trading data is soft, the impact is limited; the exchange has strengthened its competitiveness through a diversified layout. The stablecoin USDC continues to grow, raising its market share and generating synergistic benefits. Institutional investors are bullish on a market recovery and believe the exchange has upside potential.
GateNews13m ago
BTC 15-minute rise 0.48%: stronger spot buy-side demand combined with shrinking liquidity driving the move
2026-04-13 14:30 to 2026-04-13 14:45 (UTC), BTC saw a +0.48% return within a 0.55% amplitude range (71600.7–71997.0 USDT). During this period, market volatility increased; both spot and on-chain data indicate that short-term capital flows were notably active, market attention rose, and sentiment remains cautious.
The main driver behind this deviation is stronger spot-market buy pressure and the continued net outflow of exchange funds. Specifically, over the past 24 hours, BTC spot trading volume was about $33.15B, compared with the 7-day average
GateNews1h ago
Bitmine gets promoted to the NYSE main board! Tom Lee: US stocks may be at their bottom, and selling pressure on Ether could ease
Bitmine has officially transferred from the NYSE American board to the main board in the United States, marking an important milestone for the company. Despite a significant drop in its share price, it has still increased the share repurchase plan amount to $4.0 billion. The company holds a large amount of Ether, and it expects that a rebound in the crypto market will help improve its assets and share price performance.
CryptoCity1h ago
Gold and silver fall across the board, and the BTC/ETH volatility index rises slightly
On April 13, gold and silver prices fell to $4,732.92 per ounce and $74.209 per ounce, respectively. The BTC volatility index rose by 0.42%, and the ETH volatility index rose by 0.31%. The U.S. dollar versus the Chinese yuan and the Japanese yen edged up slightly, major European stock indexes generally fell, while WTI and Brent crude oil prices rose. The Gate platform supports trading for multiple asset types.
GateNews2h ago
ETH 15-minute rise of 1.24%: On-chain capital outflows and macro risk aversion converge to boost volatility
From 2026-04-13 13:45 to 14:00 (UTC), ETH surged rapidly within a 1.48% amplitude. The price ranged from 2182.61 to 2214.98 USDT, and the return rate in 15 minutes reached +1.24%. This bout of unusual activity has drawn market attention, with active capital inflows and outflows, a marked increase in volatility, and a short-term warming of trading sentiment.
The main driver behind this unusual activity is on-chain capital outflows and changes in the holdings structure. Over the past few weeks, the net positions of the 1k–10k ETH whale cohort and the 10k+ super whale cohort have continued to decline, around April 13, the related
GateNews2h ago
Bitcoin retreats to $71k, spot ETF net inflows of nearly $1 billion last week
Bitcoin and Ethereum prices were holding steady around April 13, and the overall crypto market weakened. Oil prices rebounded, influenced by the situation in the Middle East. Bitcoin ETF funds worth nearly $1 billion flowed in, but addresses still in unrealized losses remain in the majority, and open interest in futures contracts fell significantly.
GateNews2h ago
