
Key Takeaways
-
Aster (ASTER) has hit a new all-time low near $0.54 amid a broader crypto market sell-off.
-
The current price structure closely mirrors Hyperliquid (HYPE)’s 2025 bottoming fractal, which preceded a 200%+ rally.
-
ASTER is forming a potential rounding bottom after a ~77% drawdown from its peak.
-
A reclaim of the 50-day moving average near $0.79 could signal early trend reversal.
-
The activation of ASTER’s Strategic Buyback Reserve may help stabilize price and reduce circulating supply.
As of January 19, 2026, Aster (ASTER) is under heavy pressure, printing a fresh all-time low at $0.5420. The sharp drop comes amid a broader market sell-off triggered by escalating US–EU trade tensions, which wiped out nearly $875 million in leveraged long positions across crypto. Bitcoin (BTC) and Ethereum (ETH) are both down 2–3% on the day, and smaller-cap tokens like ASTER have taken the brunt of the impact.
ASTER has now fallen more than 12% in the past 24 hours, but beneath the surface, the price structure is beginning to tell a more nuanced story. Interestingly, the current setup closely resembles the bottoming fractal previously seen in Hyperliquid (HYPE) — a structure that ultimately preceded a powerful upside reversal.
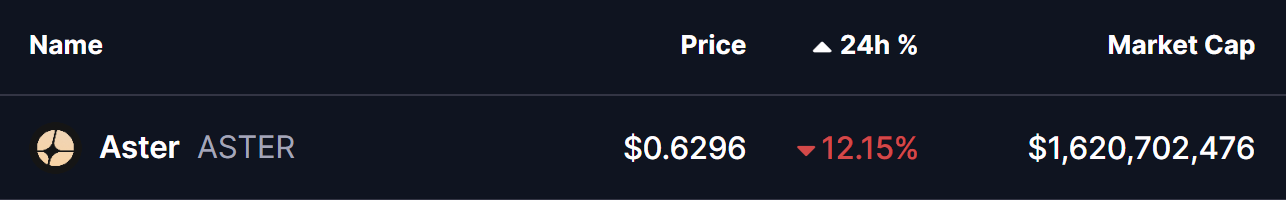
Source: Coinmarketcap
ASTER Mirrors HYPE’s Bottoming Path
A closer look at the comparative chart reveals striking similarities between ASTER’s current price action and HYPE’s April 2025 bottoming phase.
HYPE’s move started with a sharp correction following its all-time high. Price slipped below the 50-day moving average, signaling a momentum shift. Instead of continuing lower aggressively, HYPE entered a rounding bottom structure, reflecting gradual seller exhaustion. The final low came after a deep 73% drawdown from the peak, marking a clear inflection point in market sentiment.
What followed was critical. HYPE reclaimed both the 50-day and 100-day moving averages, confirming a trend shift. That technical reclaim ignited a breakout from the rounding base, leading to a 207% rally — one of HYPE’s most notable reversals of 2025.
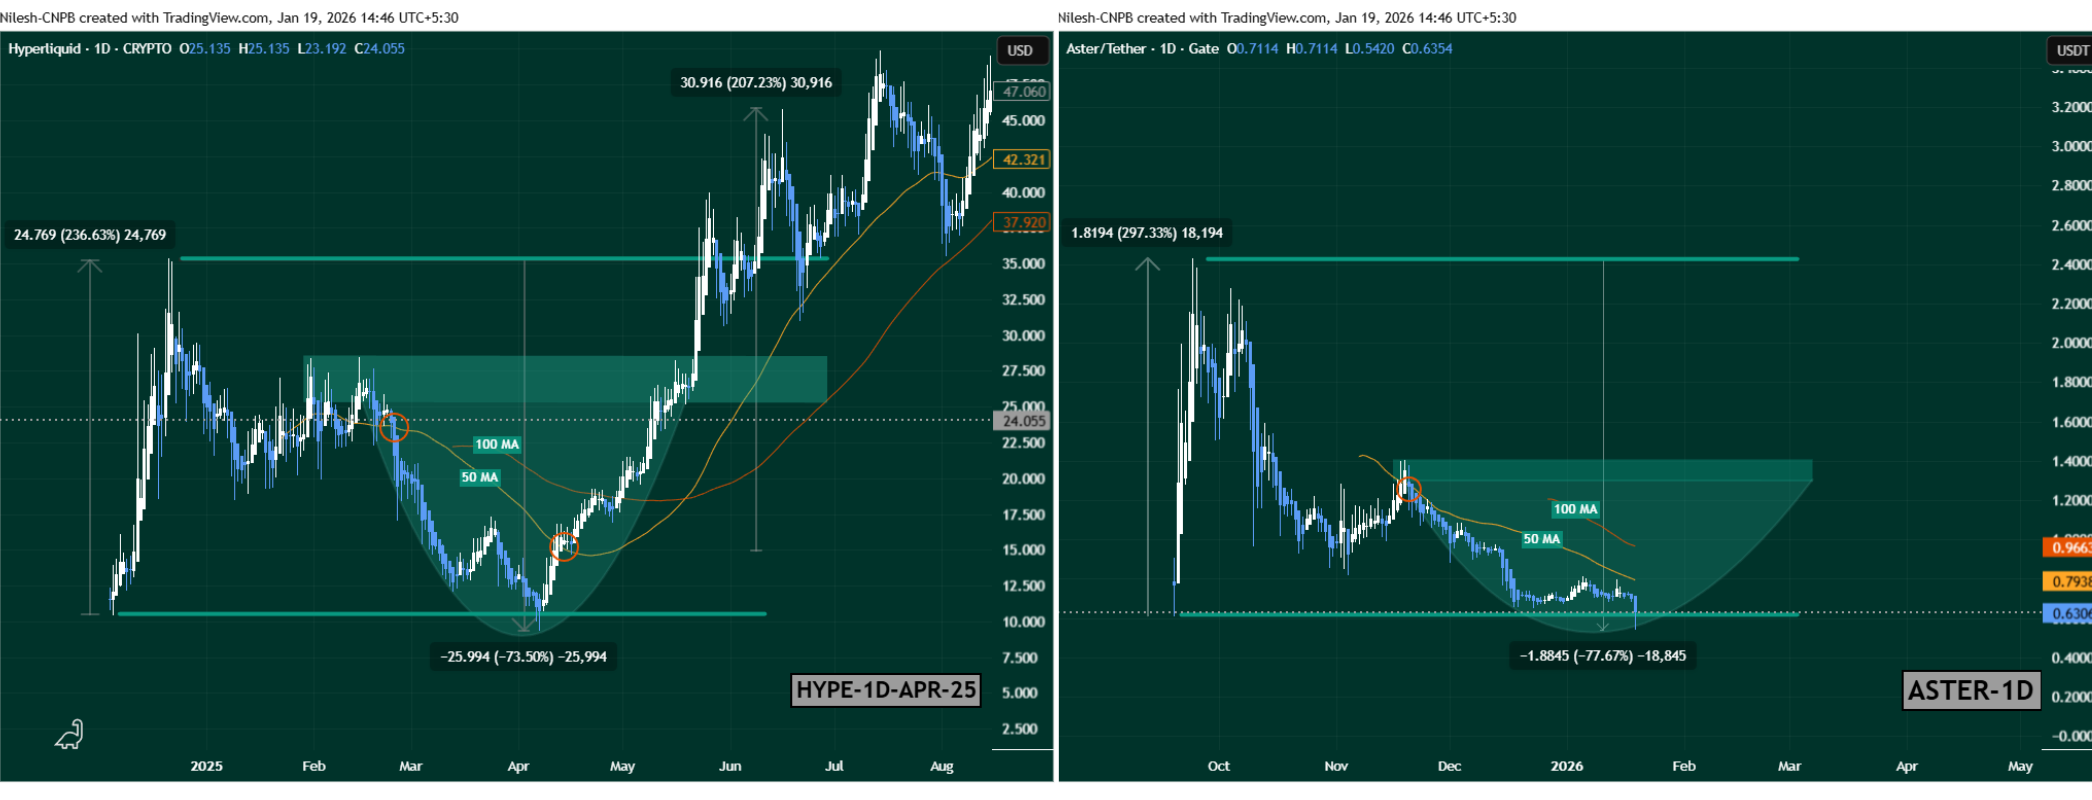
HYPE and ASTER Fractal Chart/Coinsprobe (Source: Tradingview)
ASTER now appears to be walking a similar road.
After topping near its all-time high around $2.42, ASTER entered a prolonged corrective phase and lost its 50-day moving average. Price has since been carving out what looks like a rounding bottom, with today’s low near $0.54, representing a steep 77% drawdown from the top. The structure, momentum loss, and gradual flattening strongly resemble HYPE’s pre-reversal behavior highlighted in the fractal comparison.
What’s Next for ASTER?
If this fractal continues to unfold, ASTER may be approaching a critical inflection point.
From a bullish perspective, the first key confirmation would be a reclaim of the 50-day moving average, currently sitting near $0.7983. A sustained move above this level would signal weakening bearish momentum and growing buyer confidence.
Beyond that, the major level to watch lies at the neckline resistance near $1.4066. A clean breakout above this zone could shift ASTER into a broader recovery phase, potentially mirroring the type of upside expansion HYPE experienced once its reversal was confirmed.
Adding to the constructive backdrop, Aster activated its Strategic Buyback Reserve today. The protocol is now automatically repurchasing $ASTER using 20–40% of daily platform fees, expanding its Stage 5 buyback program launched in December 2025. These buybacks are on-chain verifiable, dynamically adjusted based on market conditions, and designed to gradually reduce circulating supply. Notably, early buyback activity is already visible on-chain, and the timing coincides with ASTER printing fresh lows — a move widely viewed as a stabilization effort.
Key Risk Note
While fractal similarities can provide valuable context, they are not guarantees. Market conditions, liquidity profiles, and sentiment can vary significantly between assets and cycles. ASTER still needs confirmation through moving average reclaims and follow-through buying. A failure to hold current support zones would weaken the bottoming thesis and open the door to further downside.
Bottom Line
ASTER appears to be approaching a make-or-break zone. The emerging rounding bottom, historical fractal similarity to HYPE, and the launch of an active buyback mechanism all point toward a potential shift in momentum. Whether this structure evolves into a confirmed bottom or turns into another pause before continuation lower will depend on how price reacts around the 50-day moving average and key resistance levels in the days ahead.
Disclaimer: The views and analysis presented in this article are for informational purposes only and reflect the author’s perspective, not financial advice. Technical patterns and indicators discussed are subject to market volatility and may or may not yield the anticipated results. Investors are advised to exercise caution, conduct independent research, and make decisions aligned with their individual risk tolerance.
About Author: Nilesh Hembade is the Founder and Lead Author of Coinsprobe, with over 5 years of experience in the cryptocurrency and blockchain industry. Since launching Coinsprobe in 2023, he has been providing daily, research-driven insights through in-depth market analysis, on-chain data, and technical research.
Disclaimer: The information on this page may come from third parties and does not represent the views or opinions of Gate. The content displayed on this page is for reference only and does not constitute any financial, investment, or legal advice. Gate does not guarantee the accuracy or completeness of the information and shall not be liable for any losses arising from the use of this information. Virtual asset investments carry high risks and are subject to significant price volatility. You may lose all of your invested principal. Please fully understand the relevant risks and make prudent decisions based on your own financial situation and risk tolerance. For details, please refer to
Disclaimer.
Related Articles
Why is Bitcoin up today? Trump says Iran is seeking a truce, and risk assets move higher across the board
On April 15, Bitcoin rebounded about 6% after Trump said Iran is seeking to reach an agreement, breaking above $75,000. Expectations for the resumption of U.S.-Iran negotiations warmed up, lifting Asian stock markets. Technically, roughly $6 billion worth of short positions were forced to close, accelerating the rebound. Analysts said that if the U.S.-Iran situation continues to ease, Bitcoin could break through $80,000, and they predicted it may reach $150,000 by year-end.
MarketWhisper52m ago
Bitmine is promoted to the NYSE main board! Tom Lee: US stocks may be at a bottom, and selling pressure on Ether could ease
Bitmine officially transferred from the NYSE American market to the main board, marking a significant milestone for the company. Despite a sharp drop in its share price, it still increased the share repurchase program to $4 billion. The company holds a large amount of Ether, and expects that a rebound in the crypto market will help improve its assets and share price performance.
CryptoCity1h ago
ETH 15-minute up 0.66%: On-chain large transfers in sync drove a net inflow of funds, boosting spot buying pressure
2026-04-15 00:00 to 00:15 (UTC), ETH shows a local anomaly. The 15-minute return rate is +0.66%. The trading price range is 2321.93–2343.2 USDT, with a range of 0.92%. During this period, market attention increased, volatility slightly intensified, buy pressure in the order book shifted upward in the short term, and quickly pushed spot prices up into a key resistance area.
The main drivers of this anomaly are large on-chain transfers and inflows of capital in combination. At the beginning of the window, multiple large ETH transfers appeared, including 8,676 ETH and 6,551 ETH, respectively, transferring from a large source to the
GateNews1h ago
BTC 15-minute drop of 0.54%: Liquidity worsens and whales actively reduce positions, putting short-term pressure on the market
From 22:15 to 22:30 (UTC) on 2026-04-14, BTC saw a short-term pullback of 0.54% within the high-range band of 73911.6 - 74314.4 USDT, with a return of -0.54%. During this period, market swings were evident, volatility intensified, attention from the market quickly increased, and downward pressure on the order book was prominent.
The main drivers behind this unusual move were the continued deterioration of market liquidity and a clear lack of order book depth, which made the BTC price extremely sensitive to large sell orders. At the same time, during the key time window, whale wallets carried out large transfers and also engaged in active de-risking,
GateNews3h ago
ETH 15-minute drop of 0.61%: Sell orders concentrate and release while bearish sentiment intensifies, increasing downward pressure
2026-04-14 22:15 to 2026-04-14 22:30 (UTC) during this period, on the 15-minute K-line, ETH recorded a -0.61% return, with a price range of 2313.68 to 2328.54 USDT and a fluctuation of 0.64%. During this period, market attention increased, trading volume expanded noticeably, and heightened short-term volatility sparked strong interest in the subsequent trend.
The main drivers behind this unusual move are the concentrated release of sell orders and continued net outflows of on-chain funds. Specifically, the sell volume share rose to 52%, higher than the buy side at 48%, indicating heavy selling pressure
GateNews3h ago
TAO Falls 6.9% in 24 Hours as Covenant Exit and Market Rotation Weigh on Price
Bittensor's TAO token fell 6.9% to $238.91 amid a week-long decline linked to Covenant AI's exit due to centralized control concerns. Competing AI tokens had smaller declines. Despite the downturn, TAO remains the top AI token by market cap, with Grayscale increasing its allocation.
GateNews3h ago
