Key Takeaways
-
Solana (SOL) is under short-term pressure as the broader crypto market faces heavy liquidation-driven selling.
-
The daily chart suggests a potential inverted head and shoulders pattern, a classic bullish reversal structure.
-
The $123 zone is acting as a critical support area where buyers have previously stepped in.
-
SOL remains below the 50-day moving average near $132.65, which is a key resistance level for bulls.
-
A reclaim of the 50-day MA could open the door for a move toward the $142–$147 neckline resistance.
-
A breakdown below the $126–$121 region would invalidate the bullish setup and increase downside risk.
**Solana (SOL) **is trading in the red as the broader crypto market remains under pressure over the past 48 hours. Risk sentiment has turned cautious once again, with Bitcoin (BTC) slipping below the $90,000 mark and Ethereum (ETH) tumbling nearly 7% in the last 24 hours. This sharp move triggered more than $689 million in liquidations, with long positions accounting for roughly $629 million of the damage.
Amid this market-wide sell-off, SOL has dropped over 5%. However, beneath the red candles, Solana’s daily chart is beginning to hint at a potential technical setup that could shape its next move.
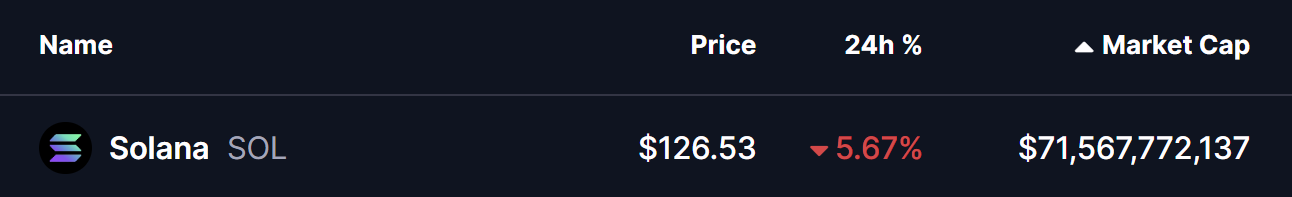
Source: Coinmarketcap
Emerging Inverted Head and Shoulders Pattern
On the daily timeframe, Solana appears to be forming a possible inverted head and shoulders pattern, one of the more reliable bullish reversal structures when confirmed.
-
The left shoulder formed in late November around the $123 zone.
-
Price then sold off more deeply to create the head near $119, marking a local capitulation low.
-
The latest rejection from the neckline resistance zone between $142 and $147 has pushed SOL lower again, with price now drifting back toward the $123 area. This move is shaping what could become the right shoulder.
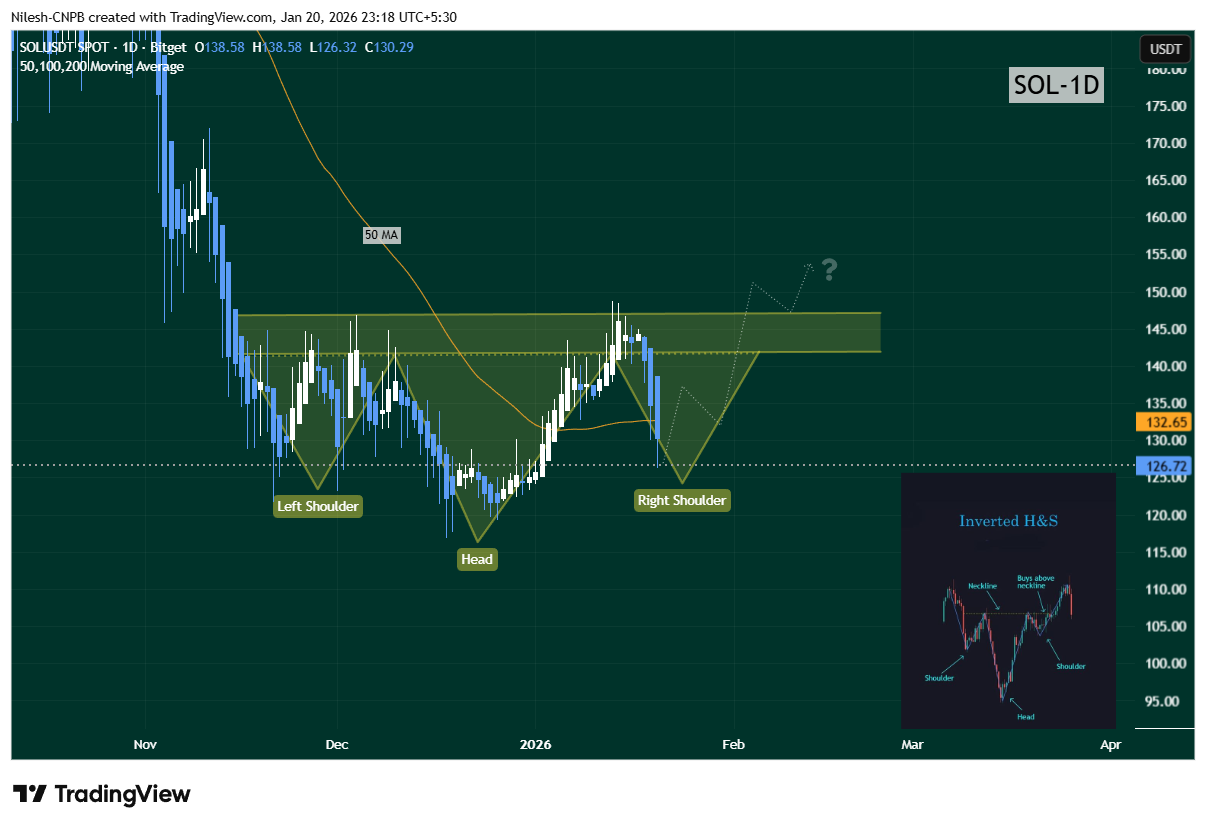
Solana (SOL) Daily Chart/Coinsprobe (Source: Tradingview)
This structure suggests that sellers may be losing momentum after repeated attempts to push price lower, while buyers continue to defend the same demand zone.
Key Resistance Still Overhead
Despite the developing pattern, SOL is still trading below its 50-day moving average, currently positioned near $132.65. This moving average has flipped into a key overhead resistance and remains a crucial level for bulls to reclaim. As long as SOL stays below this line, upside attempts may struggle to gain traction.
What’s Next for SOL?
If the inverted head and shoulders pattern continues to develop, SOL could find support near the $123 region, completing the right shoulder and setting the stage for a rebound. A successful push back above the 50-day moving average would be an early bullish signal and could open the door for a renewed move toward the neckline resistance zone at $142–$147.
A decisive breakout above this neckline sees the pattern confirmed and could trigger a short-term bullish rally as momentum traders step back in.
On the flip side, the bullish setup remains vulnerable. A breakdown below the $126–$121 support zone would invalidate the inverted head and shoulders structure and increase the risk of further downside.
Outlook
For now, Solana sits at a technical crossroads. While broader market weakness continues to weigh on price, the developing chart structure suggests that selling pressure may be fading. Traders will be watching closely to see whether SOL can hold the $123 support and reclaim the 50-day moving average — a move that could turn this dip into a potential rebound opportunity.
Disclaimer: The views and analysis presented in this article are for informational purposes only and reflect the author’s perspective, not financial advice. Technical patterns and indicators discussed are subject to market volatility and may or may not yield the anticipated results. Investors are advised to exercise caution, conduct independent research, and make decisions aligned with their individual risk tolerance.
About Author: Nilesh Hembade is the Founder and Lead Author of Coinsprobe, with over 5 years of experience in the cryptocurrency and blockchain industry. Since launching Coinsprobe in 2023, he has been providing daily, research-driven insights through in-depth market analysis, on-chain data, and technical research.
Disclaimer: The information on this page may come from third parties and does not represent the views or opinions of Gate. The content displayed on this page is for reference only and does not constitute any financial, investment, or legal advice. Gate does not guarantee the accuracy or completeness of the information and shall not be liable for any losses arising from the use of this information. Virtual asset investments carry high risks and are subject to significant price volatility. You may lose all of your invested principal. Please fully understand the relevant risks and make prudent decisions based on your own financial situation and risk tolerance. For details, please refer to
Disclaimer.
Related Articles
Aave Proposes 25,000 ETH to DeFi United for Kelp DAO Relief
Aave service providers put forth a governance proposal on Friday that would contribute 25,000 ETH worth nearly $58 million from the protocol's DAO to DeFi United, a coordinated relief effort to restore backing for rsETH following the Kelp DAO exploit, according to The Block.
The proposed contributi
CryptoFrontier2h ago
Solana Eyes $87 Breakout as Bullish Signals Strengthen
Solana sits near key resistance around $87 as on-chain activity and positive funding buoy bullish momentum; whale-led demand in derivatives supports a potential breakout. RSI >50 and positive MACD indicate rising upside, with a path toward $92–$97 and support near $77.
CryptoNewsLand2h ago
Solana Price Holds Range as $90 Resistance Caps Breakout
Key Insightsthe price
Solana trades between $85 and $86 after a pullback, while an ascending channel pattern supports bullish structure with strong demand near support levels.
Momentum indicators, including MACD and Aroon, suggest strengthening buying pressure, reinforcing expectations of a
CryptoNewsLand4h ago
Solana Spot ETF Sees $1.17M Net Outflow as FSOL Records Inflows
Gate News message, April 26 — Solana spot ETFs recorded net outflows of $1.1736 million yesterday (April 24), according to SoSoValue data. The total assets under management for SOL spot ETFs reached $883 million as of reporting time, with a net asset ratio of 1.77% and cumulative net inflows of $1.0
GateNews11h ago
Solana Meme Coin Memecoin Breaks $12.23M Market Cap, Surges 37.3% in 24 Hours
Gate News message, April 26 — Memecoin, a Meme token on Solana, has surged 37.3% over the past 24 hours and breached a market capitalization of $12.23 million today, according to on-chain data monitoring.
BlockBeats notes that Meme coin trading carries substantial volatility and is largely driven b
GateNews15h ago
Solana Eyes $87 Breakout as Bullish Signals Strengthen
Solana sits near key resistance around $87 as on-chain activity and positive funding buoy bullish momentum; whale-led demand in derivatives supports a potential breakout. RSI >50 and positive MACD indicate rising upside, with a path toward $92–$97 and support near $77.
CryptoNewsLand04-25 18:36