Key Takeaways
-
OriginTrail (TRAC) has surged around 12% in a single day, drawing renewed attention to the token.
-
TRAC has broken out from an ascending triangle near $0.46 on the daily chart, signaling growing bullish momentum.
-
Similar breakout structures in July and October 2025 previously led to strong rallies of 63% and 113%.
-
Holding the $0.44–$0.46 zone as support will be crucial to keep the bullish fractal setup intact.
-
If the pattern plays out, TRAC could attempt a move toward its long-term ascending resistance above $1.00.
OriginTrail, the decentralized knowledge graph protocol, is stepping back into the spotlight as its native token TRAC records a strong 12% daily surge. Beyond the price jump, the real signal is coming from the charts, where a familiar fractal breakout structure is starting to emerge on the daily timeframe, hinting that a larger upside move could be forming.
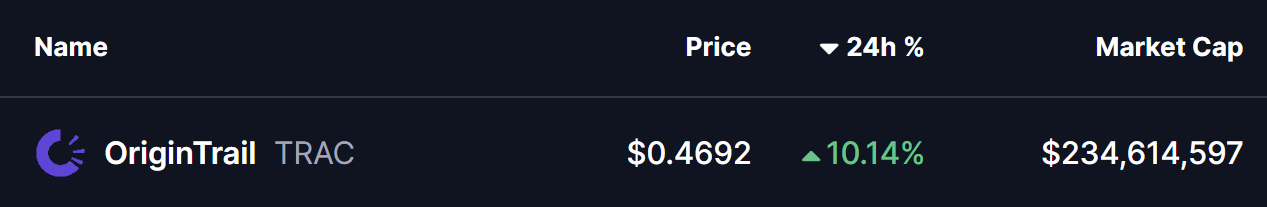
Source: Coinmarketcap
Fractal Breakout Hints at Potential Upside Move
On the daily chart, TRAC has confirmed a breakout from an ascending triangle pattern near the $0.46 level. This breakout is particularly important as price is now trading just above the 200-day moving average, a level that has historically acted as a major trend-defining zone for TRAC.
What makes this setup more compelling is its similarity to previous breakout phases. In late July 2025, a comparable structure resulted in a 63% upside move after price held above its breakout base. Later, in early October 2025, TRAC broke out from a right-angled descending broadening wedge pattern. That move was followed by a reclaim of the 200-day moving average and ultimately led to a powerful 113% rally.
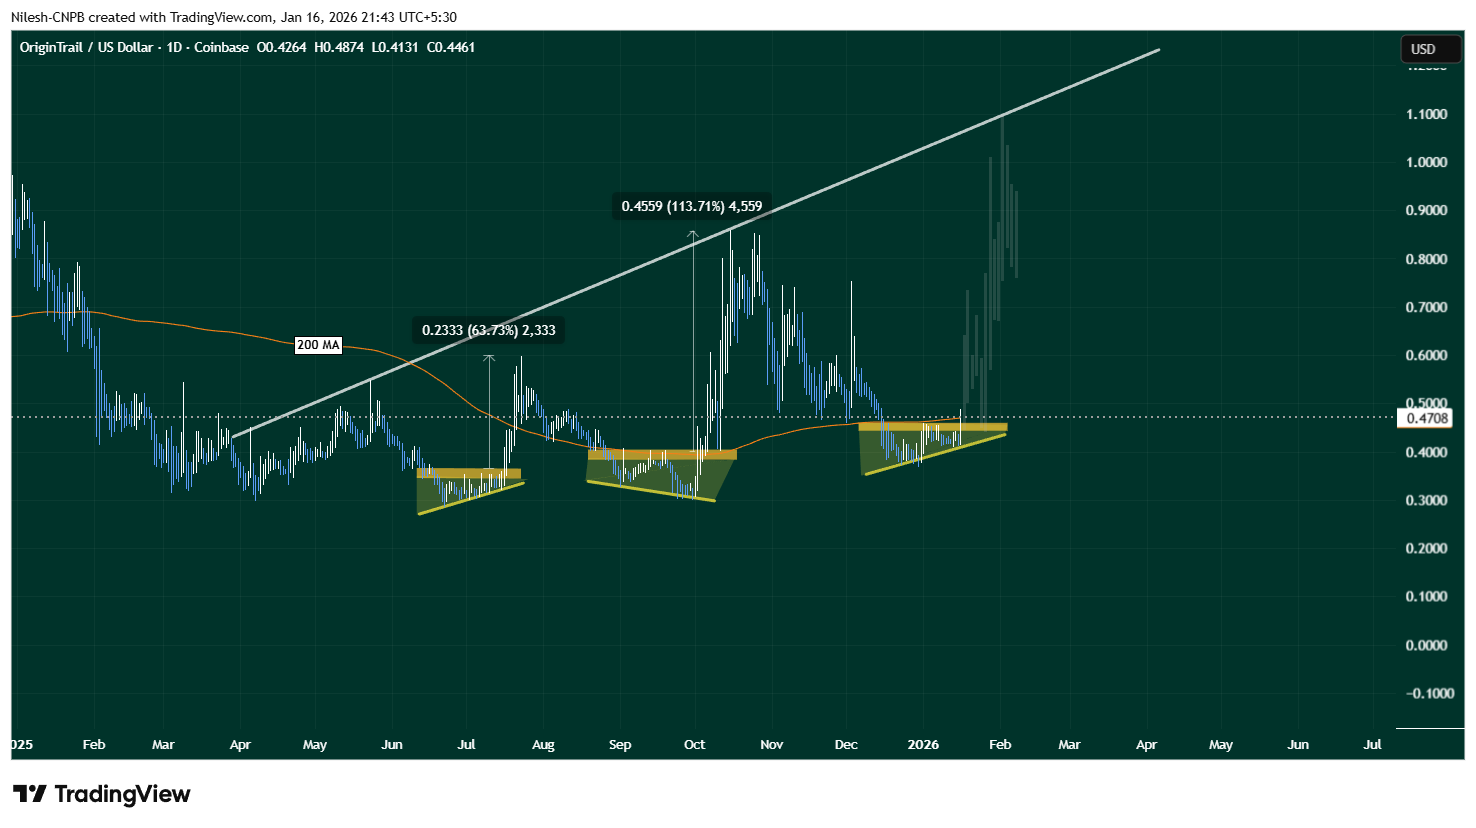
OriginTrail (TRAC) Daily Chart/Coinsprobe (Source: Tradingview)
The current setup shares key characteristics with those earlier moves. Price compression, a clean breakout, and interaction with the 200-day MA suggest that TRAC may once again be transitioning from consolidation into expansion.
What’s Next for TRAC?
If this fractal breakout plays out as expected, holding the $0.44–$0.46 zone as support will be crucial. A sustained hold above this range, along with continued strength above the 200-day moving average, could act as a launchpad for further upside.
In that scenario, TRAC may attempt a move toward its long-term ascending resistance trendline, which currently sits above the $1.00 level. A push toward that zone would align closely with the magnitude of prior fractal-driven rallies seen on the chart.
That said, fractal patterns are never guarantees. Broader market conditions, liquidity, and overall sentiment will continue to influence price action. A failure to hold the $0.44–$0.46 support zone or a rejection back below the 200-day moving average could invalidate the breakout and weaken the bullish fractal thesis.
Bottom Line
TRAC is showing early signs of another technically significant breakout, supported by historical fractal behavior and a reclaim of a key long-term moving average. If buyers can defend the current support zone, the chart suggests that OriginTrail may be positioning itself for a larger upside move in the weeks ahead.
Disclaimer: The views and analysis presented in this article are for informational purposes only and reflect the author’s perspective, not financial advice. Technical patterns and indicators discussed are subject to market volatility and may or may not yield the anticipated results. Investors are advised to exercise caution, conduct independent research, and make decisions aligned with their individual risk tolerance.
About Author: Nilesh Hembade is the Founder and Lead Author of Coinsprobe, with over 5 years of experience in the cryptocurrency and blockchain industry. Since launching Coinsprobe in 2023, he has been providing daily, research-driven insights through in-depth market analysis, on-chain data, and technical research.
Disclaimer: The information on this page may come from third parties and does not represent the views or opinions of Gate. The content displayed on this page is for reference only and does not constitute any financial, investment, or legal advice. Gate does not guarantee the accuracy or completeness of the information and shall not be liable for any losses arising from the use of this information. Virtual asset investments carry high risks and are subject to significant price volatility. You may lose all of your invested principal. Please fully understand the relevant risks and make prudent decisions based on your own financial situation and risk tolerance. For details, please refer to
Disclaimer.
Related Articles
PEPE on the Edge: Will ETF Momentum Push Prices Higher?
ETF filing boosted PEPE sentiment, but confirmation remains uncertain.
Price compresses near support, signaling a possible breakout soon.
Resistance levels must break to confirm bullish momentum.
PepeCoin — PEPE, has returned to center stage after fresh ETF chatter shook the market.
CryptoNewsLand27m ago
Crypto Sector Wavers As Geopolitical Tensions Influence Market Performance
The crypto market has seen a 1.14% decline, with Bitcoin and Ethereum experiencing slight gains. Top gainers include PEPE and IRISnet. DeFi TVL increased, while NFT sales dropped. Notable events include xAI suing Colorado and South Korea tightening crypto regulations.
BlockChainReporter53m ago
U.S. March CPI data is about to be released: market expectations and analysis of crypto capital flows
Analyze market expectations before the release of the U.S. March CPI data, divergences in the inflation structure, and the potential transmission pathways to crypto assets’ risk appetite.
InstantTrends2h ago
Grayscale Says Aave Could Become Household Name
Grayscale says Aave could become mainstream, highlighting its decentralized lending model without intermediaries.
Bank of Canada finds Aave has lower margins due to reduced costs but flags risks from leveraged trading.
Governance issues and liquidations persist, though upgrades and ETF
CryptoFrontNews2h ago
The Crypto Fear and Greed Index rises to 16, and market panic sentiment slightly eases
Gate News message, on April 10, according to Alternative data, the crypto fear and greed index today is 16, up 2 points from yesterday’s 14, with the market’s “fear” sentiment slightly easing. The index threshold range is 0-100; based on an overall assessment of market sentiment, its components include: volatility (25%), market trading volume (25%), social media buzz (15%), market surveys (15%), Bitcoin’s share across the entire market (10%), and Google trending search analysis (10%).
GateNews3h ago
Differing Views Leaves Crypto Community in Disarray, Bearish vs Bullish BTC Expectations
Differing views leaves crypto community in disarray.
Bearish vs bullish BTC price expectations are discussed.
Price indicators support the possibility for either outcome.
The crypto community continues to face challenges in the form of heated discussions between bullish and bearish
CryptoNewsLand3h ago
