Cardano (ADA) experienced a decline of more than 3% at the time of writing on Thursday, marking the second time this month that the price has failed to break above the 50-day exponential moving average (EMA). Buying pressure has weakened from retail investors, leading to a decrease in open interest (OI) and causing the funding rate to continue cooling off. On a technical level, ADA’s upward momentum is waning, increasing the risk of a deeper correction as the key support zone around $0.3826 faces a challenge.
Cardano losing strength from retail investors as market sentiment fluctuates
Cardano is gradually losing appeal among retail investors as the cryptocurrency market unexpectedly shifts to a risk-avoidance stance. This negative development is likely driven by the U.S. Senate Banking Committee’s sudden postponement of the digital asset market framework discussion — originally scheduled for Thursday — to the end of January, thereby increasing cautious sentiment across the market.
According to data from CoinGlass, ADA’s open interest (OI) has decreased by 2.70% in 24 hours, down to $826.15 million. This figure clearly reflects a capital outflow trend from the market, consistent with the weakening risk appetite among traders.
Notably, during the same period, ADA futures saw $1.29 million in liquidations on long (Long) positions, far exceeding the $226,910 in short (Short) positions. This indicates a strong sweep of bullish bets.
Meanwhile, the funding rate continues to plummet, currently at just 0.0004% at the time of writing, down sharply from 0.0076% earlier in the day. This development indicates a significant decline in traders’ willingness to hold long positions, further compounded by increasing liquidation pressure on longs.
 ADA Derivatives Data | Source: CoinGlass## Weakening momentum increases the risk of a negative correction
Cardano is struggling to find momentum to break out of the downtrend formed from the peaks on October 27 and December 9, as the price repeatedly faces rejection at the 50-day EMA around $0.4158. At the time of observation, ADA has turned downward and retreated close to the short-term accumulation zone’s bottom, coinciding with the January 3 low at $0.3826.
Losing this critical support level could trigger a deeper correction wave, opening the possibility of the price falling back to the December 31 low around $0.3294.
In terms of momentum, the MACD indicator still maintains a positive histogram, but the height of the bars is shrinking significantly, indicating weakening bullish momentum. However, the MACD line and signal line remain above zero, suggesting a mildly positive trend that has not been completely broken.
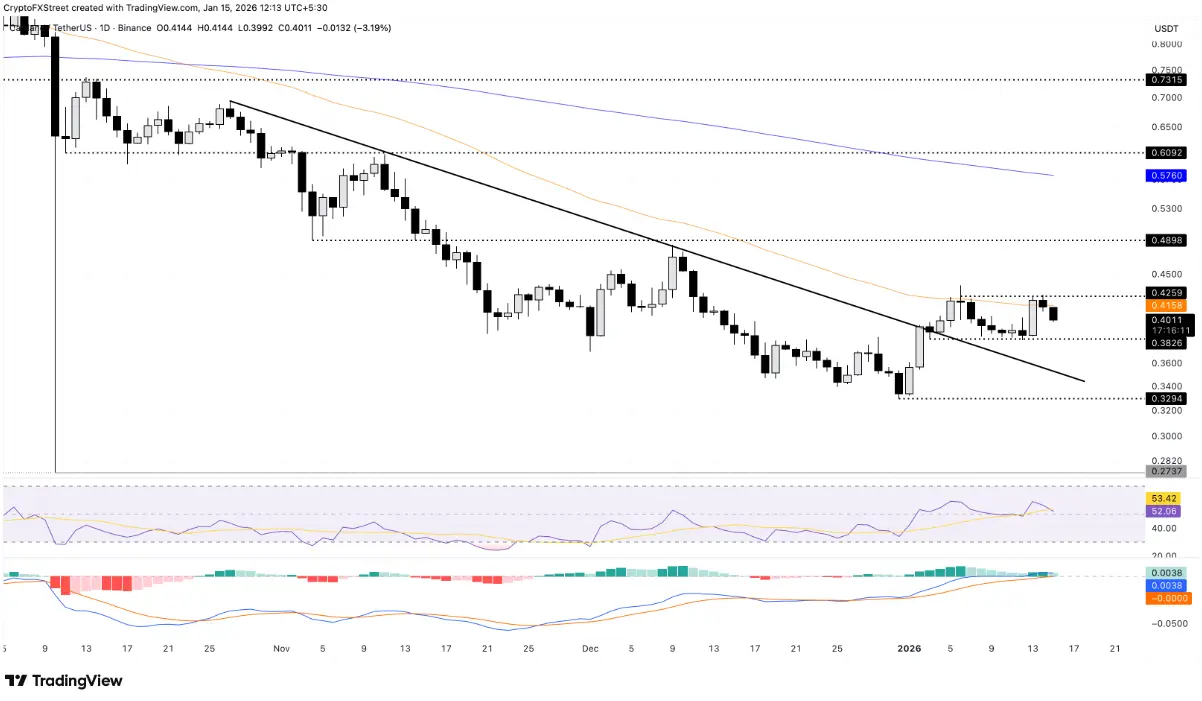 Daily ADA/USDT Chart | Source: TradingView Meanwhile, the RSI oscillates around 52 — a typical neutral zone during sideways accumulation phases. If buying interest improves early, ADA still has room to extend its recovery. Conversely, a decline in momentum will increase the risk of breaking below the $0.3826 support.
In a more optimistic scenario, if ADA avoids closing below this support zone, the recovery trend remains intact, with the immediate target being to retest the 50-day EMA at $0.4158.
Disclaimer: The information on this page may come from third parties and does not represent the views or opinions of Gate. The content displayed on this page is for reference only and does not constitute any financial, investment, or legal advice. Gate does not guarantee the accuracy or completeness of the information and shall not be liable for any losses arising from the use of this information. Virtual asset investments carry high risks and are subject to significant price volatility. You may lose all of your invested principal. Please fully understand the relevant risks and make prudent decisions based on your own financial situation and risk tolerance. For details, please refer to
Disclaimer.
Related Articles
PEPE Holds Tight Range as Bearish Pressure Limits Upside
Key Insights:
PEPE trades within a narrow consolidation range as sellers maintain control, while repeated resistance rejections prevent any sustained bullish momentum in the market.
Fibonacci resistance zones continue to cap upside potential, with multiple barriers aligning alongside
CryptoNewsLand12m ago
Shiba Inu Defies Bearish Setup as Short Squeeze Lifts Price
Key Insights
Shiba Inu price surged despite bearish death cross signals as short liquidations intensified, driving a rapid upward move during low liquidity conditions.
A dragonfly doji and tightening Bollinger Bands supported bullish momentum, reinforcing a reversal pattern after sustained d
CryptoNewsLand16m ago
Solana Recovery Gains Pace While Derivatives Data Shows Split Sentiment
Key Insights
Solana records four consecutive days of gains as funding rates rise, signaling stronger retail interest while overall market conviction remains divided across participants.
Declining futures Open interest alongside rising funding rates highlights reduced trader exposure,
CryptoNewsLand1h ago
Solana Eyes $90 as Volume Surge Fuels Short-Term Rally
Key Insights:
The Solana price rebounded from recent lows near $80 as trading volume surged sharply, signaling renewed participation and stronger short-term market momentum.
A golden cross on lower time frames reinforced bullish sentiment, with technical indicators suggesting continued
CryptoNewsLand1h ago
ETH 15-minute drop of 0.69%: Price pressure from declining burn volume and short-term capital arbitrage
2026-04-09 18:00 to 2026-04-09 18:15 (UTC), ETH closed down 0.69% within a 0.88% intraday trading range, with the price fluctuating between 2203.91 and 2223.58 USDT. Trading volume in this range rose slightly, market attention stayed high, but short-term volatility increased, prompting investor caution.
The main drivers behind this unusual move are that ETH on-chain Gas fees have fallen to historical lows, causing the EIP-1559 burn amount to decline. As a result, the net-supply contraction effect weakened, and the supply-demand structure faced adjustment pressure in the short term. Meanwhile,
GateNews1h ago
BTC drops 0.62% over 15 minutes: exchange net inflows intensify and short-term arbitrage converges to trigger volatility
From 18:00 to 18:15 on April 9, 2026 (UTC), the BTC price return recorded -0.62%, closing in the range of 71857.8 to 72375.1 USDT, with a trading range of 0.72%. Market attention was notably elevated, volatility intensified, and capital moved quickly within a short period. Overall market sentiment has become more cautious, and investors’ willingness to trade in the short term has increased.
The main driving force behind this abnormal move is an increase in net inflows to BTC exchanges during the anomaly window; the 10-minute net flow reached 755.92 BTC, indicating that some investors chose to transfer funds to exchanges to seek arbitrage opportunities in the midst of the volatility issue
GateNews1h ago
