
**Date: **Wed, Jan 07, 2026 | 06:20 AM GMT
The broader cryptocurrency market continues to show strong New Year momentum, with Bitcoin (BTC) up around 4% and Ethereum (ETH) gaining over 9% on a weekly basis. This improving sentiment is gradually spilling over into major altcoins — including the DePIN-focused token Akash Network (AKT).
AKT has already posted an impressive 20% weekly gain. While this short-term strength has caught traders’ attention, the more important development is unfolding on the higher-timeframe chart. Recent price action suggests a meaningful shift in market structure, hinting that AKT may be transitioning out of a prolonged corrective phase and into the early stages of a bullish continuation.
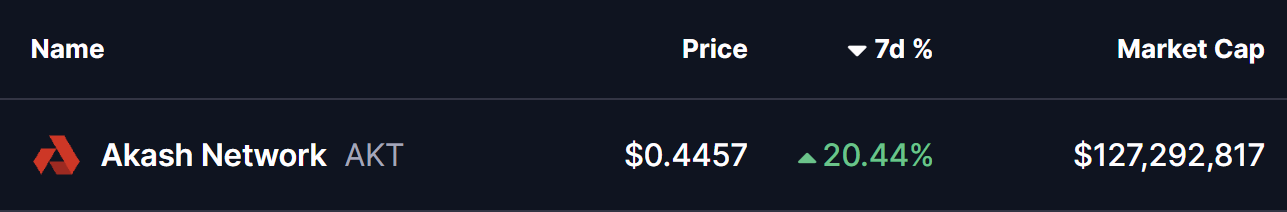
Source: Coinmarketcap
Falling Wedge and Rounding Bottom in Play
On the daily chart, AKT has been trading within a broader falling wedge — a structure that often precedes bullish reversals as selling pressure gradually weakens. Within this larger wedge, price action is also shaping a developing rounding bottom pattern, reflecting steady accumulation and seller exhaustion.
The formation began after AKT faced strong rejection near the $0.5441 resistance zone in late November. That rejection triggered a sharp sell-off, pushing price lower toward the $0.3465 region. However, bears failed to extend losses beyond this area. Instead, demand stepped in, downside momentum slowed, and price began to stabilize.
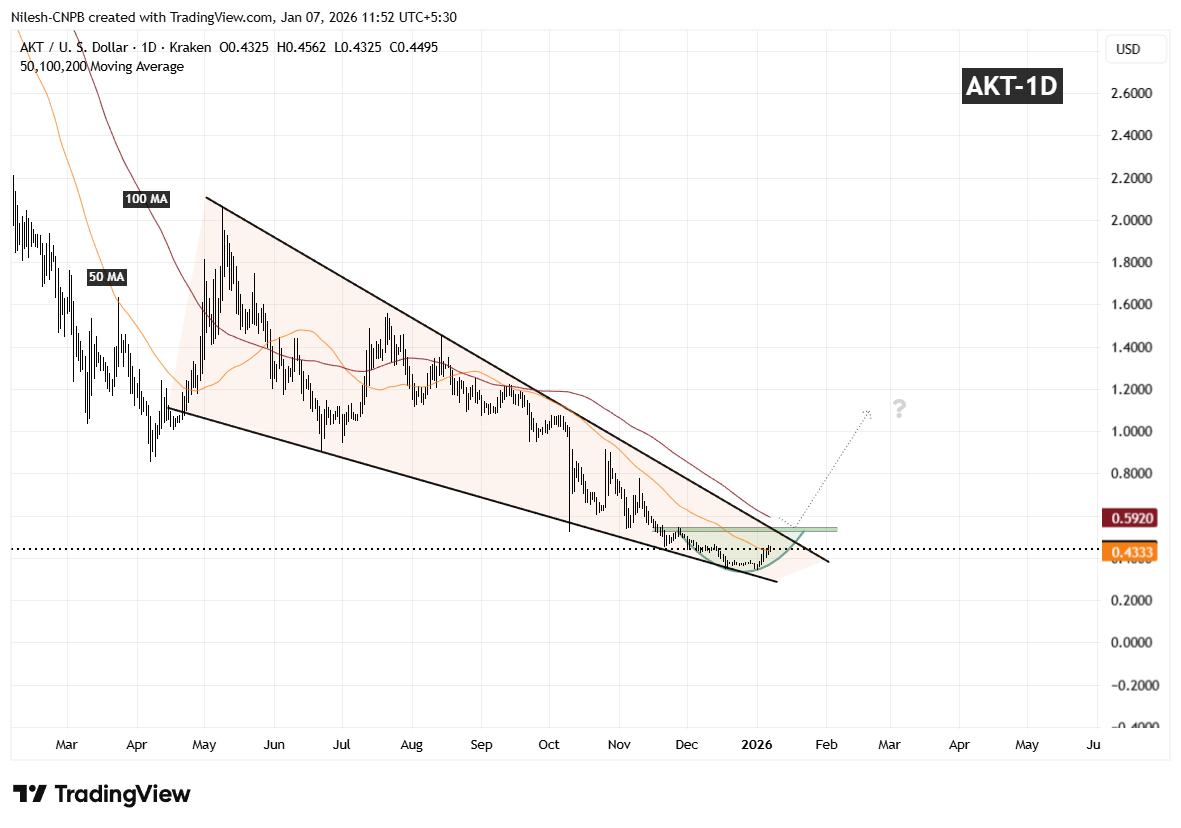
Akash Network (AKT) Daily Chart/Coinsprobe (Source: Tradingview)
Over the following weeks, volatility compressed and AKT started to curl higher in a smooth, rounded fashion — closely matching the textbook behavior of a rounding bottom. Importantly, the recent rebound has pushed price back above the 50-day moving average around $0.4333, a level that had previously acted as resistance and is now beginning to flip into support.
What’s Next for AKT?
If AKT can continue to hold above the 50-day moving average, this area may act as a solid base for further upside attempts. From here, attention shifts toward the descending resistance trendline of the falling wedge, which aligns closely with the $0.5441 resistance zone.
A clean and decisive breakout above this confluence area, followed by sustained acceptance, would confirm a broader bullish expansion phase and mark a clear trend reversal from the prior downtrend. Such a move would likely attract renewed momentum participation as the market recognizes the structural shift.
Until that breakout occurs, the pattern remains in development. Short-term consolidation or shallow pullbacks are still possible as price digests recent gains. However, as long as AKT continues to print higher lows above the established base, the broader technical structure remains constructive.
Overall, the chart suggests AKT is approaching a critical inflection point — one that could determine whether this recovery evolves into a sustained bullish trend as 2026 progresses.
Disclaimer: The views and analysis presented in this article are for informational purposes only and reflect the author’s perspective, not financial advice. Technical patterns and indicators discussed are subject to market volatility and may or may not yield the anticipated results. Investors are advised to exercise caution, conduct independent research, and make decisions aligned with their individual risk tolerance.
About Author: Nilesh Hembade is the Founder and Lead Author of Coinsprobe, with over 5 years of experience in the cryptocurrency and blockchain industry. Since launching Coinsprobe in 2023, he has been providing daily, research-driven insights through in-depth market analysis, on-chain data, and technical research.
Disclaimer: The information on this page may come from third parties and does not represent the views or opinions of Gate. The content displayed on this page is for reference only and does not constitute any financial, investment, or legal advice. Gate does not guarantee the accuracy or completeness of the information and shall not be liable for any losses arising from the use of this information. Virtual asset investments carry high risks and are subject to significant price volatility. You may lose all of your invested principal. Please fully understand the relevant risks and make prudent decisions based on your own financial situation and risk tolerance. For details, please refer to
Disclaimer.
Related Articles
Bitcoin (BTC) Stuck in a ‘No Trade Zone:’ When Is the Next Big Move Coming?
The primary cryptocurrency has experienced significant volatility lately, mainly due to the geopolitical tension caused by the war in the Middle East.
One popular analyst described the current price area as a “no-trade zone,” arguing that a clear move in either direction will depend on how BTC
CryptoPotato17m ago
Why is Bitcoin up today? Trump pauses strikes on Iranian energy facilities, and the Fed signals support for risk markets
Bitcoin rebounded to above $67,000 on March 31, mainly driven by signals from U.S.-Iran diplomacy and the Federal Reserve’s decision to keep interest rates unchanged. Market sentiment temporarily improved, but Iran’s Ministry of Foreign Affairs said that the lack of direct negotiations could limit the rebound. The potential impact of the Strait of Hormuz toll bill on supply chains is pushing up oil prices and putting pressure on the market; it’s important to closely monitor future price movements.
MarketWhisper18m ago
Today’s Crypto Fear and Greed Index rose to 11, and the market is in a state of extreme fear
Gate News, March 31, according to Alternative.me data, today the crypto Fear and Greed Index rose to 11, putting the market in extreme fear. Yesterday, the index was 8, also in extreme fear.
GateNews39m ago
Why Higher XRP Prices Make Payments Cheaper, Ripple’s Schwartz Clarifies Misconception
A key misunderstanding around XRP is being clarified in a way that reframes its upside, showing that higher prices can enhance payment efficiency, strengthen liquidity dynamics, and position the asset more competitively for large-scale global transactions.
XRP Price Efficiency Liquidity
Coinpedia48m ago
Bitcoin’s Most Dangerous Pattern Just Triggered: Will BTC Dump to $26K Next?
Although bitcoin has already dumped by over 50% from its all-time high of over $126,000 marked in October to a multi-year low of $60,000, the asset’s troubles might not be over, warned Merlijn The Trader.
The popular analyst indicated that the “most dangerous bitcoin pattern just completed phase
CryptoPotato1h ago
Bittensor (TAO) Hits a 3-Month Peak: What Caused the Rally and What Comes Next?
Many leading cryptocurrencies have posted slight declines or negligible increases over the past 24 hours, but this isn’t the case for Bittensor (TAO), whose price soared by 15%.
The question now is whether this momentum can hold or if a pullback is coming next.
Further Gains
CryptoPotato2h ago
