
**Date: **Sat, Jan 03, 2026 | 01:26 PM GMT
As 2026 kicks off, the broader cryptocurrency market is showing renewed stability. Ethereum (ETH) has reclaimed the $3,100 level, and several major altcoins are already beginning to pick up momentum. Against this improving backdrop, Kaspa (KAS) is quietly positioning itself as a potential late mover, with its chart structure starting to flash early bullish signals.
While KAS is trading slightly in the red today and remains mostly flat on the weekly timeframe, the more important story is unfolding beneath the surface. Recent price action suggests a meaningful structural shift may be underway — one that could mark the early stages of a bullish continuation if confirmed.
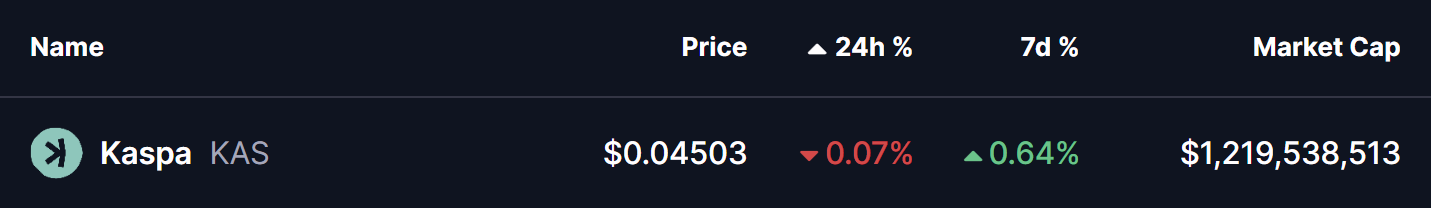
Source: Coinmarketcap
Rounding Bottom in Play
On the 4-hour timeframe, Kaspa appears to be forming a rounding bottom pattern, a classic bullish reversal structure that typically develops after a prolonged corrective phase. This pattern reflects a slow but steady transition from distribution to accumulation, as selling pressure weakens and buyers gradually regain control.
The setup began after KAS faced strong rejection near the $0.06310 neckline zone, which triggered a sharp decline through late November and December. That downside move eventually found strong demand near the $0.040 level, which has since acted as a key support area. Multiple defenses of this zone prevented further downside and helped establish a stable base for a potential trend reversal.
Since carving out that bottom, KAS has started to curve higher in a smooth, rounded fashion — closely matching the textbook structure of a developing rounding bottom. The recent stabilization above the $0.045 region further supports the idea that downside momentum is fading.
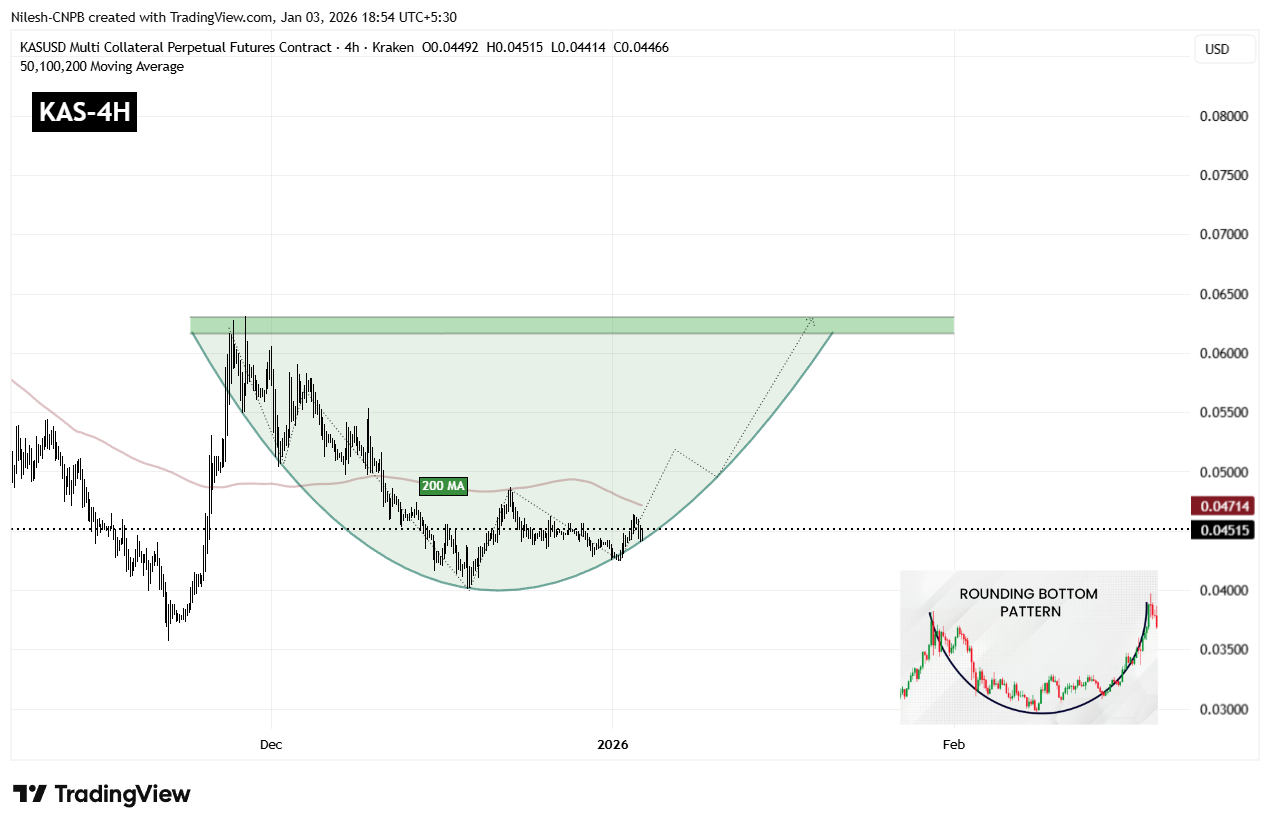
Kaspa (KAS) 4H Chart/Coinsprobe (Source: Tradingview)
A key technical level now comes into focus: the 200-period moving average, currently hovering near $0.04714. This level has acted as dynamic resistance during the recovery phase, and reclaiming it would mark an important shift in short-term market structure.
A sustained move above the 200 MA would indicate that buyers are regaining control after months of corrective price action and could act as the trigger for a stronger upside continuation.
What’s Next for KAS?
For full confirmation of the rounding bottom pattern, KAS must eventually reclaim the $0.06310 neckline resistance. A clean breakout above this zone would validate the entire reversal structure and could open the door to a broader bullish expansion phase, with momentum traders likely re-entering the market.
Until that breakout occurs, the pattern remains in development. Short-term consolidation or shallow pullbacks remain possible, especially near moving average resistance. However, as long as price continues to hold above the $0.04245 support base and maintains higher lows, the broader bottoming structure remains intact and constructive.
In the near term, all eyes remain on the 200 MA and the neckline zone. How Kaspa reacts around these levels will likely determine whether this emerging bullish setup evolves into a confirmed breakout move or requires more time to mature.
Disclaimer: The views and analysis presented in this article are for informational purposes only and reflect the author’s perspective, not financial advice. Technical patterns and indicators discussed are subject to market volatility and may or may not yield the anticipated results. Investors are advised to exercise caution, conduct independent research, and make decisions aligned with their individual risk tolerance.
About Author: Nilesh Hembade is the Founder and Lead Author of Coinsprobe, with over 5 years of experience in the cryptocurrency and blockchain industry. Since launching Coinsprobe in 2023, he has been providing daily, research-driven insights through in-depth market analysis, on-chain data, and technical research.
Disclaimer: The information on this page may come from third parties and does not represent the views or opinions of Gate. The content displayed on this page is for reference only and does not constitute any financial, investment, or legal advice. Gate does not guarantee the accuracy or completeness of the information and shall not be liable for any losses arising from the use of this information. Virtual asset investments carry high risks and are subject to significant price volatility. You may lose all of your invested principal. Please fully understand the relevant risks and make prudent decisions based on your own financial situation and risk tolerance. For details, please refer to
Disclaimer.
Related Articles
Why Is Bitcoin Up Today? Hormuz Blockade Triggers Short Squeeze and a BTC Test of $75k
On April 13, Bitcoin rose from its early-session low of 70,741 to trade as high as $74,900 during the session, approaching the $75,000 level. The main drivers came from two directions: after Trump ordered the blockade of the Strait of Hormuz, traders began to view Bitcoin as a geopolitical hedge asset; and a massive net short position that had been building as funding rates stayed persistently negative was met with liquidation, triggering a chain of liquidations totaling millions of dollars near the $70,000 support level.
MarketWhisper38m ago
Bitmine gets promoted to the NYSE main board! Tom Lee: U.S. stocks may have bottomed out, and Ether’s selling pressure may ease
Bitmine has officially moved from the NYSE American board to the main board in the United States, marking an important milestone for the company. Despite a sharp drop in its stock price, it has still increased its share repurchase authorization to $4.0 billion. The company holds a large amount of Ether, and it predicts that a rebound in the crypto market will help boost its assets and stock price performance.
CryptoCity1h ago
U.S. stocks have recovered the losses since the Iran war, while Bitcoin pushes up to 74K
Due to market expectations that the United States and Iran will reach an agreement, the S&P 500 index has rebounded to its highest level since the war, and Bitcoin has also surged to $74,900. Despite the failure of peace talks between the U.S. and Iran, the U.S. has imposed a maritime blockade to pressure Iran. MicroStrategy once again made a large-scale purchase of Bitcoin, indicating that investor confidence is picking up.
ChainNewsAbmedia1h ago
BTC 15-minute surge up 0.77%: Spot buy-side demand and on-chain activity convergence drive short-term strength
2026-04-13 22:00 to 2026-04-13 22:15 (UTC), the BTC price fluctuated upward within 15 minutes, with a return of +0.77%. The high and low prices in the range were between 73178.0 and 73899.0 USDT, and the amplitude was 0.99%. During the event, market attention increased, volatility slightly intensified, and overall sentiment leaned positive.
The main driver behind this price deviation was active spot market buy orders stepping in, which pushed the BTC price higher in the short term. The number of active addresses on-chain remained at a high level, reflecting an increase in genuine trading demand. Trading volume was higher than in the previous period,
GateNews3h ago
Bitmine gets promoted to the NYSE main board! Tom Lee: US stocks may be bottoming out, and sell pressure on Ether could ease
Bitmine has officially moved from the NYSE American board to the main board in the United States, marking an important milestone for the company. Despite a sharp drop in its share price, it has still increased the share repurchase plan amount to $4.0 billion. The company holds a large amount of Ether, and it expects that a rebound in the crypto market will help improve its assets and share price performance.
CryptoCity4h ago
