
Date: 11 Jan 2026, 06:20 PM GMT
Key Highlights
-
Pump.fun (PUMP) posts over 6% intraday gains as broader crypto market sentiment improves.
-
The 4H chart shows a bearish ABCD harmonic pattern, with the bullish CD leg currently in play.
-
Price rebounded strongly from the 100-period moving average, reinforcing trend strength.
-
The pattern projects a potential upside move toward the $0.00296 region.
-
Holding above the $0.00225 support zone remains critical to sustain the bullish structure
The broader cryptocurrency market has regained modest upward momentum today, with both Bitcoin (BTC) and Ethereum (ETH) returning to positive territory. This improvement in sentiment has helped stabilize the altcoin space, and Pump.fun (PUMP) is emerging as one of the stronger performers, posting over a 6% intraday gain.
Beyond the short-term price bounce, PUMP’s chart structure is beginning to show a technically constructive setup that suggests additional upside could be developing.

Source: Coinmarketcap
Harmonic Pattern Signals Bullish Continuation
On the 4-hour timeframe, PUMP appears to be forming a bearish ABCD harmonic pattern — a structure that often develops during the later stages of an uptrend. While this pattern can eventually signal a reversal once the final leg completes, the CD leg itself is typically driven by strong bullish momentum, often producing notable upside before any exhaustion sets in.
As illustrated on the chart, the pattern initiated at Point A near $0.00179, followed by a sharp impulsive rally into Point B around $0.00272. Price then entered a corrective phase, pulling back toward Point C near $0.00203.
Importantly, this retracement aligned closely with the 100-period moving average, where buyers stepped in decisively. The swift reaction from this zone reinforced the strength of the underlying trend and helped preserve the harmonic structure.
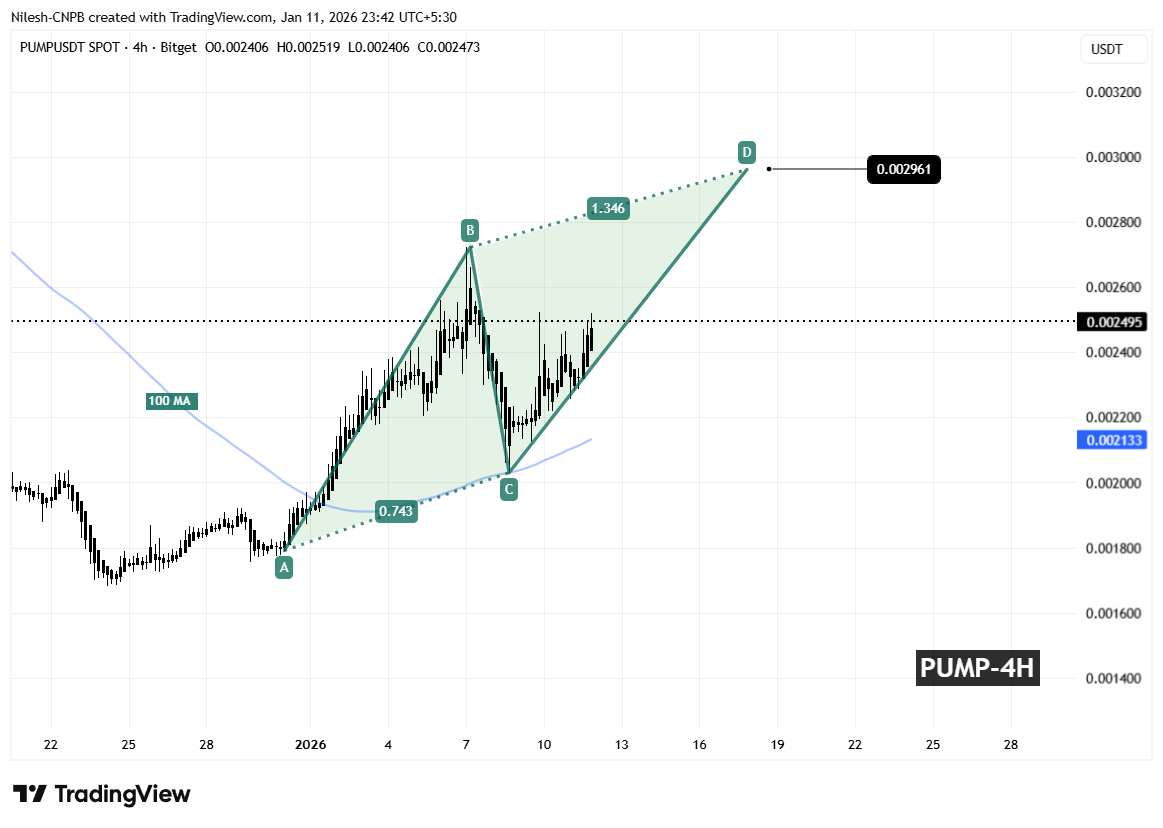
Pump.fun (PUMP) 4H Chart/Coinsprobe (Source: Tradingview)
Since bouncing from Point C, PUMP has resumed its advance and is now trading back around the $0.0025 area, signaling that the CD leg is actively unfolding.
What Could Come Next for PUMP?
If the ABCD pattern continues to play out as projected, the CD leg could extend toward the 1.346 Fibonacci projection of the BC segment. This places the Potential Reversal Zone (PRZ) near $0.00296, which sits roughly 18% above current price levels.
This zone is typically where traders begin to watch for signs of short-term exhaustion or profit-taking, as harmonic patterns often complete around these extensions. Until then, momentum favors the bulls, provided the structure remains intact.
From a risk perspective, holding above the $0.00225 support region will be crucial. A decisive breakdown below this level would weaken the harmonic setup and increase the likelihood of renewed downside pressure.
For now, PUMP’s price action remains technically constructive, with buyers defending key levels and momentum pointing toward a possible continuation higher before any broader consolidation or reversal attempt emerges.
Frequently Asked Questions (FAQ)
What is driving Pump.fun (PUMP) price higher today?
PUMP is benefiting from improving overall market sentiment and a bullish harmonic structure on the 4-hour chart, supported by strong buying interest near the 100-period moving average.
What pattern is forming on the PUMP chart?
The chart indicates a bearish ABCD harmonic pattern. While such patterns can lead to reversals at completion, the CD leg often produces strong bullish momentum before that point.
What is the upside target for Pump.fun (PUMP)?
If the CD leg continues, the projected upside target lies near the $0.00296 level, which aligns with the 1.346 Fibonacci extension.
Is Pump.fun (PUMP) still bullish in the short term?
As long as price remains above key support and momentum holds, the short-term outlook remains cautiously bullish.
Disclaimer: The views and analysis presented in this article are for informational purposes only and reflect the author’s perspective, not financial advice. Technical patterns and indicators discussed are subject to market volatility and may or may not yield the anticipated results. Investors are advised to exercise caution, conduct independent research, and make decisions aligned with their individual risk tolerance.
About Author: Nilesh Hembade is the Founder and Lead Author of Coinsprobe, with over 5 years of experience in the cryptocurrency and blockchain industry. Since launching Coinsprobe in 2023, he has been providing daily, research-driven insights through in-depth market analysis, on-chain data, and technical research.
Disclaimer: The information on this page may come from third parties and does not represent the views or opinions of Gate. The content displayed on this page is for reference only and does not constitute any financial, investment, or legal advice. Gate does not guarantee the accuracy or completeness of the information and shall not be liable for any losses arising from the use of this information. Virtual asset investments carry high risks and are subject to significant price volatility. You may lose all of your invested principal. Please fully understand the relevant risks and make prudent decisions based on your own financial situation and risk tolerance. For details, please refer to
Disclaimer.
Related Articles
Why is Bitcoin rising today? Trump plans to declare the end of the war, and the short covering potential is being strengthened.
U.S. President Trump plans to announce that Iran’s military targets have been achieved, the war is nearing its end, and the U.S. and Iran are in talks to negotiate a ceasefire. This situation is boosting market sentiment and pushing Bitcoin higher. K33 Research shows that Bitcoin ETF shorts have reached a historical high, and the market structure indicates signs that a bottom may be forming, suggesting a possible near-term uptrend.
MarketWhisper9m ago
ETH 15-minute rally up 0.72%: technical rebound signals and derivatives positions in sync drive the market up
From 2026-04-02 00:30 to 2026-04-02 00:45 (UTC), the ETH 15-minute candlestick shows a gain of +0.72%. The price range is 2137.74 to 2157.47 USDT, with a swing of 0.92%. The volatility is moderate, but as market attention to this unusual move increases, the interest in related market conditions and risk discussions also rises.
The main driver of this unusual move is the convergence of multiple technical rebound signals and derivatives positioning at high levels. A long-legged doji on the monthly chart has formed, creating expectations of a trend reversal. On the daily chart, the RSI is already at 42, having dropped into the oversold zone. 4
GateNews25m ago
Today’s Crypto Fear and Greed Index has risen to 12, and the market is in extreme fear.
Gate News message, April 2, according to Alternative.me data, today the Crypto Fear and Greed Index rose to 12 (the index was 8 yesterday), and the market is in an "extreme fear" state.
GateNews30m ago
Here’s the Shiba Inu (SHIB) Price if Burn Rate Collapse Triggers a Supply Shock
Shiba Inu is experiencing dual narratives: it's now recognized as a digital commodity, yet faces pressure from a high exchange influx and a drastic 98% drop in burn rate. While the price remains steady at $0.00000609, future movements depend on increased burn activity and market demand.
CaptainAltcoin2h ago
Markets Down 25%, Sentiment Up 80%: 5 Macro Catalysts—From Trade Easing to Fed Printing that Could Ignite the Next Explosive Surge.
Market sentiment is rising despite a 25% decline, signaling early accumulation behavior.
Macro factors like easing policy and weaker dollar support altcoin recovery potential.
Infrastructure and narrative-driven tokens may lead the next market phase.
The crypto market has plunged into a
CryptoNewsLand3h ago
Solana Price Holds Near $80 as Analysts Split on Next Move
Key Insights:
Solana trades near $80 under pressure, with persistent lower highs and weak recovery attempts reinforcing a clear short-term bearish market structure.
Analysts identify the $75 to $45 range as a key accumulation zone, supported by historical demand levels and long-term
CryptoNewsLand5h ago
