
**Date: **Wed, Jan 07, 2026 | 08:00 AM GMT
The broader cryptocurrency market continues to show strong New Year momentum, with Bitcoin (BTC) up nearly 4% and Ethereum (ETH) posting weekly gains of over 9%. This improving risk sentiment is now extending beyond majors and into select altcoins — including Pudgy Penguins (PENGU).
PENGU has already delivered an impressive 45% gain over the past week. While the rally itself is notable, the more important development lies in the underlying market structure. Recent price behavior on the daily chart suggests that PENGU may be approaching a pivotal breakout zone, one that could define the next directional move.
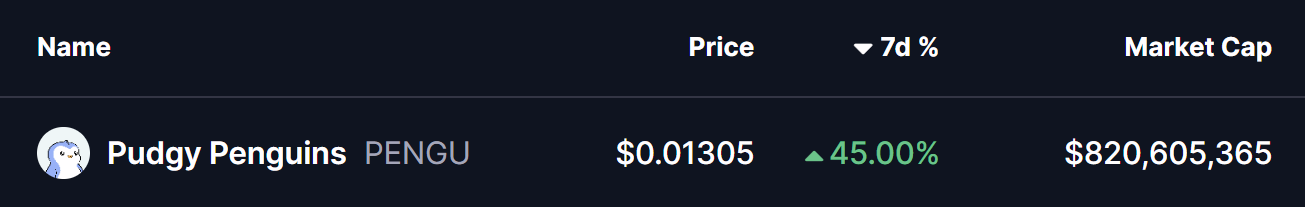
Source: Coinmarketcap
Right-Angled Descending Broadening Pattern in Play
On the daily timeframe, PENGU had been trading within a right-angled descending broadening formation — a bullish reversal pattern characterized by repeated rejections at a flat resistance level and gradually rising downside volatility.
For several weeks, price remained capped beneath the $0.01294–$0.01381 resistance band. Each attempt to push higher was met with selling pressure, keeping PENGU locked in consolidation while the lower boundary of the structure continued to expand.
That dynamic changed after a strong rebound from the lower trendline. Buyers stepped in decisively, triggering a sharp upside move that allowed PENGU to reclaim the 50-day moving average around $0.01062. This level had previously acted as persistent dynamic resistance, and reclaiming it marked a clear shift in short-term momentum.
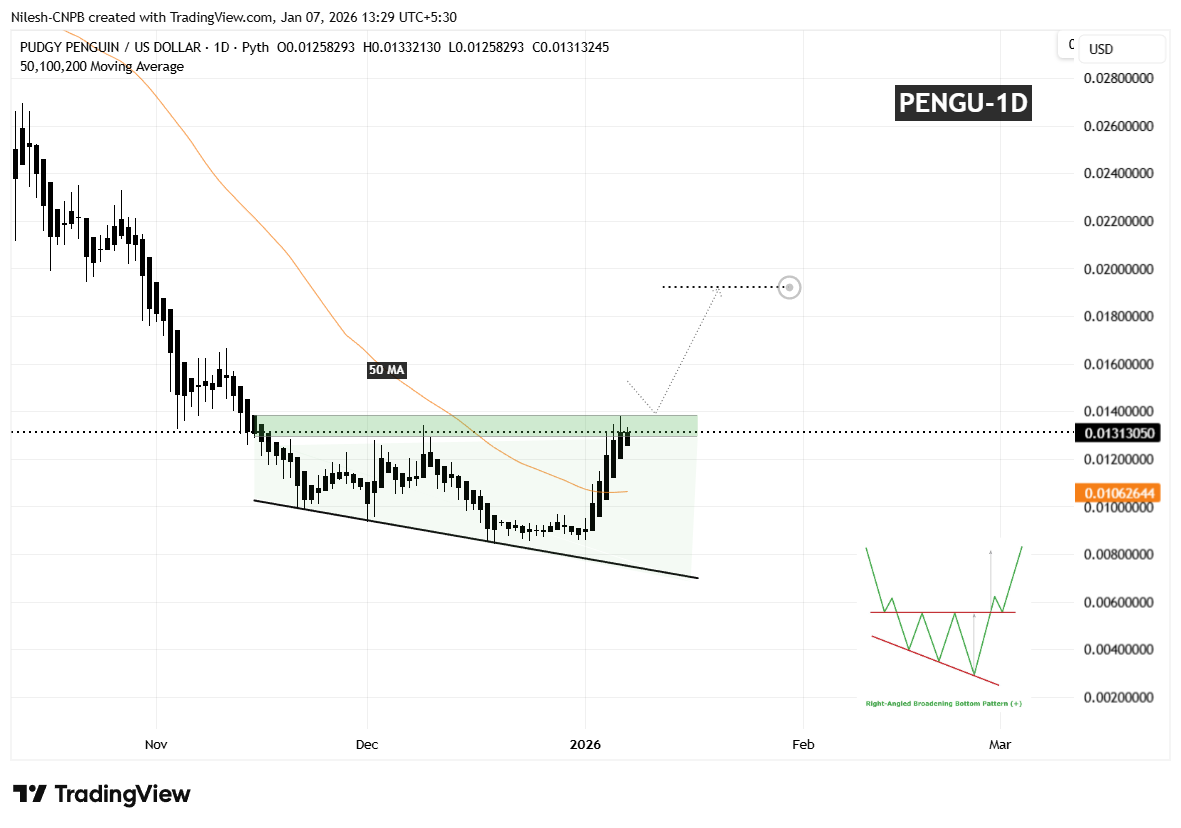
Pudgy Penguins (PENGU) Daily Chart/Coinsprobe (Source: Tradingview)
Following this reclaim, upside strength accelerated, and price has now returned to the same resistance zone that rejected advances multiple times in the past. This move back into resistance places PENGU at a critical inflection point, where market participants are once again being tested.
What’s Next for PENGU?
A decisive daily close above the $0.01294–$0.01381 resistance area would confirm a breakout from the descending broadening formation and validate the broader bullish reversal setup. Sustained acceptance above this zone would likely invite fresh momentum participation, as traders recognize the structural shift underway.
Based on the depth of the pattern and its measured move projection, a successful breakout could open the door toward the $0.01922 region. From current levels, that would represent a potential upside of roughly 45%, aligning with typical expansion behavior seen after clean breakouts from this formation.
That said, patience remains key. Prior to confirmation, PENGU could still experience short-term pullbacks, including a possible retest of the 50-day moving average, which has now transitioned into dynamic support. Such retracements would not invalidate the bullish setup as long as higher-low structures continue to form.
Until a clear breakout and follow-through occur, caution is warranted. The $0.01294–$0.01381 zone remains the defining decision area that will determine whether PENGU transitions into a sustained bullish phase or continues consolidating as the early weeks of 2026 unfold.
Disclaimer: The views and analysis presented in this article are for informational purposes only and reflect the author’s perspective, not financial advice. Technical patterns and indicators discussed are subject to market volatility and may or may not yield the anticipated results. Investors are advised to exercise caution, conduct independent research, and make decisions aligned with their individual risk tolerance.
About Author: Nilesh Hembade is the Founder and Lead Author of Coinsprobe, with over 5 years of experience in the cryptocurrency and blockchain industry. Since launching Coinsprobe in 2023, he has been providing daily, research-driven insights through in-depth market analysis, on-chain data, and technical research.
Disclaimer: The information on this page may come from third parties and does not represent the views or opinions of Gate. The content displayed on this page is for reference only and does not constitute any financial, investment, or legal advice. Gate does not guarantee the accuracy or completeness of the information and shall not be liable for any losses arising from the use of this information. Virtual asset investments carry high risks and are subject to significant price volatility. You may lose all of your invested principal. Please fully understand the relevant risks and make prudent decisions based on your own financial situation and risk tolerance. For details, please refer to
Disclaimer.
Related Articles
ETH jumps 1.22% in 15 minutes: DeFi segment activity and trading volume surge resonate to drive the move
2026-04-20 07:15 to 07:30 (UTC), ETH’s short-term return reached +1.22%. The price range spanned from 2285.19 to 2332.62 USDT, with a 2.07% amplitude. During this period, market attention heated up, volatility noticeably intensified. On-chain transaction volume rose in tandem, and key mainstream on-chain activity indicators expanded significantly on a month-over-month basis.
The primary driver of this deviation was an increase in transaction activity related to DeFi protocols, which boosted the share of on-chain Gas consumption. At the same time, total on-chain transaction volume saw a sharp surge in a short time. DeFi scenarios such as decentralized exchanges and lending protocols led to a direct surge in demand for ETH, driving funds to flow quickly into the market. In addition, the average Gas fees and Gas prices on the ETH network continued to climb in this window, further validating that high-frequency trading and active capital were accelerating into the market and strengthening short-term bullish sentiment.
Second, on-chain data also showed an expansion in liquidity related to stablecoins and ERC20 assets, strengthening market buy-side power. Although historical large-wallets such as Wilcke still held a large amount of ETH after early March, this cycle did not trigger abnormal transfers or large-scale sell-offs. Meanwhile, the positioning structure of mainstream ETH did not show passive deleveraging or concentrated liquidation. Under the combined effects of multiple factors, global buy-side demand was amplified, and short-term ETH volatility was further elevated.
Be alert to the risk of capital sustainability after a surge in high-frequency trading volume and Gas fees. If subsequent incremental buying is lacking or on-chain attention cools down, ETH may face short-term pullback pressure. Monitor changes in large-holder positions, any abnormal shifts in network fees, and liquidity volatility on the DeFi protocol chain. While there have been no signs of security incidents involving major contracts and protocols so far, short-term liquidity disturbances still need close observation. Keep monitoring fund flows and on-chain structure to stay informed about subsequent market changes.
GateNews4m ago
Bitcoin Dominance Approaches 59.9% Resistance, Altseason Signals Emerge
Bitcoin dominance has reached 59.9%, nearing a key resistance level. If rejected, analysts predict a capital shift to altcoins, potentially leading to an "altseason," as past trends show this often initiates rallies in smaller assets.
GateNews4m ago
BTC rises 0.58% in 15 minutes: whale large-capital transfers and derivatives defensive positioning drive spot buying
2026-04-20 06:30 to 2026-04-20 06:45 (UTC), the BTC price recorded a +0.58% return rate. The candlestick range was 74347.7 to 74898.0 USDT, with an amplitude of 0.74%. During this period, market attention increased because large orders and on-chain capital flow showed abnormal fluctuations, resulting in a higher overall volatility.
The main driver behind this anomalous move is whale entities concentrating large withdrawals and transfers targeting exchanges. Over the past 24 hours, the total reached 3,824 BTC, directly reducing the exchange’s BTC liquidity and bringing increased buy pressure to the spot market. On-chain data shows that the value of large transfers per transaction exceeding 1 million US dollars rose significantly during this window. As exchange immediate liquidity contracted, it pushed the BTC price upward in the short term. In addition, the derivatives market’s positioning structure changed: total futures open interest (OI) fell, and some defensive options positions shifted toward spot buying, further strengthening upside momentum.
Second, overall market liquidity remains in a fragile range. Order book data shows that large market buy orders were heavily concentrated, and buy-side depth increased noticeably. Meanwhile, in the same period, market Mempool activity and on-chain transaction fees were at low levels, and trading activity declined—making the impact of large single transfers and buy orders on price more pronounced. At the same time, leveraged funds leaving the derivatives market and options’ “maximum pain” strike price being below the spot price increased the spot market’s sensitivity to volatility. With multiple factors converging, the short-term upward price impulse was amplified.
Currently, market liquidity risk is rising, and in the short term the price is dominated by large buy orders in the order book and on-chain whale liquidity. Traders should continue to monitor the direction of whale capital flows and changes in exchange reserves, and be alert to possible price pullbacks caused by capital returning. At the same time, the key support range (72,000–74,000 USDT), order book depth, and derivatives positioning structure remain the core monitoring indicators for near-term volatility. Investors should be mindful of the risks stemming from fragile short-term liquidity and keep an eye on more real-time market developments.
GateNews49m ago
Spark's Prudent ETH Lending Strategy Proves Justified as Aave Faces Liquidity Crisis Across Multiple Chains
Spark's strategy chief defended maintaining high borrowing rates on SparkLend despite user migration to Aave, citing current market conditions. Aave is experiencing liquidity issues, raising concerns about potential bad debt if ETH prices drop significantly.
GateNews50m ago
BTC 15-minute rise of 0.53%: Institutional derivatives adding positions drives a short-term rebound
Between 2026-04-20 01:30 and 2026-04-20 01:45 (UTC), the BTC spot price fluctuated within a narrow range of 74290.9 to 74709.7 USDT. Over the 15-minute period, the return was +0.53%, with a range of 0.56%. Overall market volatility increased, drawing attention, but the number of active on-chain addresses remained steady, with no sign of extreme capital movements.
The main driver behind this move is institutional capital inflows into mainstream futures platforms and adjustments to derivatives position structures, especially CME futures open interest (OI), which rose against the trend by 2.61%. Meanwhile, some institutions added to defensive hedges and positioned for short-term rebounds within the price consolidation range. In addition, short-term Put options trading on platforms such as Deribit was active: the main contracts were concentrated on near-term downside protection, indicating that derivatives capital has increased its allocation to defensive strategies and that the spot market has passively followed the upward move.
In addition, ETF funds recorded $1.87 billion in net inflows in Q1, easing the consecutive net outflow trend seen earlier before March and providing medium-term background support for spot prices. Although on-chain active addresses over 1 hour stayed in the 19500–19600 range without abnormal increases or decreases, structural behavior by institutions across the derivatives and ETF markets converged to push short-term price volatility higher. There were no signals of sell pressure from retail traders or major whales, and no large transfers or extreme liquidation events; overall momentum came from institutional-level maneuvering.
It is worth noting that the derivatives market Put/Call ratio remains on the high side. If the price cannot continue moving upward, short-term exit pressure could intensify at any time. With overall OI shrinking, the activity of leveraged funds in the market weakens. Going forward, it is important to focus on changes in derivatives positions, ETF fund flows, and the in-and-out movements of active capital on-chain in order to respond to the risk of sharp short-term volatility. For more market information, it is recommended to continuously track relevant data indicators and capital-level anomalies.
GateNews5h ago
On-Chain Analyst ZachXBT Flags 6 Altcoins for Suspicious Price Manipulation
On-chain analyst ZachXBT flagged six altcoins (SIREN, MYX, COAI, M, PIPPIN, RIVER) for suspicious price movements akin to the RAVE token case, urging exchanges to act swiftly against market manipulation to protect retail investors.
GateNews9h ago
