
Cardano is kicking off 2026 with some renewed energy, and the chart is making one thing very clear. ADA is right back at the level that’s been holding it down for weeks.
As Sssebi put it, ADA “wants to fly” as it presses into the $0.40 zone, and that’s not hype, it’s just what the ADA chart is showing.
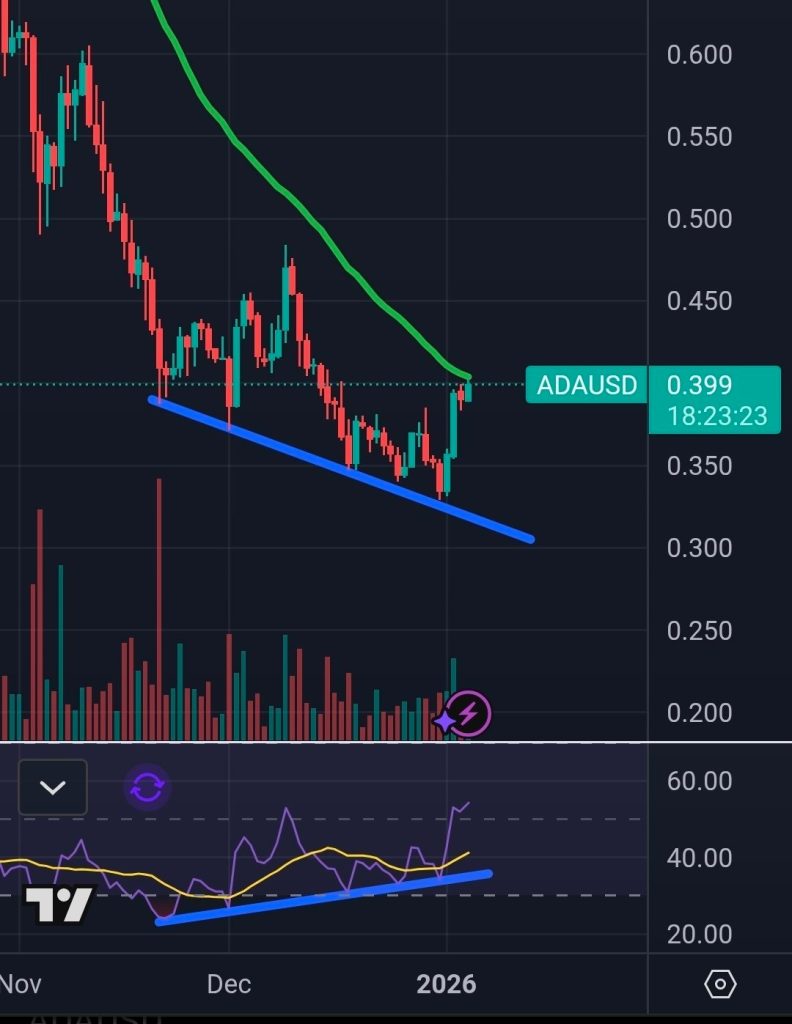
The ADA price is hovering around the area of $0.399 following the remarkable recovery. Now, it seems like the market is reaching a crossroads in terms of what might happen next.
- What the ADA Chart Is Really Saying
- RSI Is Helping the Bullish Case, But Proof Still Matters
- What’s Next for ADA?
What the ADA Chart Is Really Saying
The first thing that stands out is the pressure from above. That downward-sloping green line has acted as a lid on price, stopping multiple rally attempts. Right now, ADA is testing that trendline at the same time it’s testing horizontal resistance near $0.40, which makes this area especially important.
Source: X/@Sssebi
Below the price, the blue trendline tells another part of the story. The ADA price kept making lower lows during the pullback, but that support line held firm. When the price bounced, it did so quickly, which usually signals that sellers were running out of steam near the lows.
This is the kind of setup where the market compresses, finds a floor, and then sends price straight back into resistance to see who’s really in control.
AI Ranks LINK and SOL as Top 2026 Bets, Flags ADA as a Risk_**
RSI Is Helping the Bullish Case, But Proof Still Matters
Momentum indicators are starting to lean in favor of the bulls. On the RSI, the price was drifting lower into late December, but RSI was quietly making higher lows.
That bullish divergence often shows up when selling pressure is fading, even if the price hasn’t flipped direction yet.
Now RSI is rising along with price, which supports the idea that this bounce has some substance. Still, divergence alone isn’t enough. ADA needs to actually break and hold resistance to turn momentum into a trend.
What’s Next for ADA?
Everything revolves around $0.40. A bright breakout past that point and a hold would be a strong move. The levels to watch after that would be around the $0.45 mark, with the large psychological level at $0.50 following.
As long as 0.40 acts as a resistance level, attention turns once again to support. The first area to watch is around $0.37, followed by $0.35. Below that, the low $0.30s remain the deeper support zone that buyers don’t want to see tested again.
For now, the ADA price is doing what it needs to do. The bounce looks strong, RSI supports the move, and the price is pressing into the exact level that can change the tone of the chart.
What happens around $0.40 over the next few candles should tell the story of whether this move has real legs or needs more time to develop.
Disclaimer: The information on this page may come from third parties and does not represent the views or opinions of Gate. The content displayed on this page is for reference only and does not constitute any financial, investment, or legal advice. Gate does not guarantee the accuracy or completeness of the information and shall not be liable for any losses arising from the use of this information. Virtual asset investments carry high risks and are subject to significant price volatility. You may lose all of your invested principal. Please fully understand the relevant risks and make prudent decisions based on your own financial situation and risk tolerance. For details, please refer to
Disclaimer.
Related Articles
Israel agrees to negotiations with Lebanon, US stocks rally, and Bitcoin briefly spikes to 73K
Israeli Prime Minister Benjamin Netanyahu agrees to hold direct negotiations with Lebanon. This news boosts gains in the U.S. stock market’s S&P 500, while oil prices fall. Bitcoin’s price briefly rose to 73K; market sentiment improved slightly, but overall it has not fully rebounded. Trump urged Iran to stop its attacks to facilitate negotiations, but shipping through the strait has not improved yet.
ChainNewsAbmedia41m ago
BTC 15-minute drop of 0.42%: Large-amount net outflows and geopolitical risk-off sentiment weigh on the short-term market
From 22:30 to 22:45 (UTC) on 2026-04-09, the BTC price briefly dipped within a 0.46% amplitude range. The return was recorded at -0.42%, and the price fluctuated between 72,298.3 and 72,631.6 USDT.
During this period, market attention warmed up. Trading volume for short-term active orders increased alongside heightened volatility, and overall sentiment turned cautious.
The main driving forces behind this unusual move were net outflows of large exchange funds and a liquidity bottleneck. On-chain data shows that over the past 24 hours, the BTC exchange large-net-outflow amount reached -559.08 BTC, directly reflecting institutions and Large Investors
GateNews1h ago
XRP Whales Accumulate as Ripple Executives Head to Key XRPL Event in Japan
XRP has gained 5% from a support level of $1.28 due to increased whale accumulation, with large holders now buying over 11 million XRP daily. Ripple executives are attending a significant XRPL event in Japan, though broader market sentiment remains cautious amid geopolitical tensions.
CryptoNewsFlash3h ago
Onchain Perp DEX Volume Falls for Fifth Straight Month as March Drops to $699B
Onchain perpetual futures trading has sharply declined for five consecutive months, with March 2026 volume dropping to $699 billion from a peak of $1.36 trillion in October 2025. Hyperliquid dominates the market, capturing 34% of recent trading activity.
CryptoNewsFlash3h ago
PEPE Holds Tight Range as Bearish Pressure Limits Upside
Key Insights:
PEPE trades within a narrow consolidation range as sellers maintain control, while repeated resistance rejections prevent any sustained bullish momentum in the market.
Fibonacci resistance zones continue to cap upside potential, with multiple barriers aligning alongside
CryptoNewsLand4h ago
Shiba Inu Defies Bearish Setup as Short Squeeze Lifts Price
Key Insights
Shiba Inu price surged despite bearish death cross signals as short liquidations intensified, driving a rapid upward move during low liquidity conditions.
A dragonfly doji and tightening Bollinger Bands supported bullish momentum, reinforcing a reversal pattern after sustained d
CryptoNewsLand4h ago
