
**Date: **Sat, Jan 03, 2025 | 01:26 PM GMT
As 2026 kicks off, the broader cryptocurrency market is showing renewed stability. Ethereum (ETH) has reclaimed the $3,100 level, and several major altcoins are already beginning to pick up momentum. Against this improving backdrop, Kaspa (KAS) is quietly positioning itself as a potential late mover, with its chart structure starting to flash early bullish signals.
While KAS is trading slightly in the red today and remains mostly flat on the weekly timeframe, the more important story is unfolding beneath the surface. Recent price action suggests a meaningful structural shift may be underway — one that could mark the early stages of a bullish continuation if confirmed.
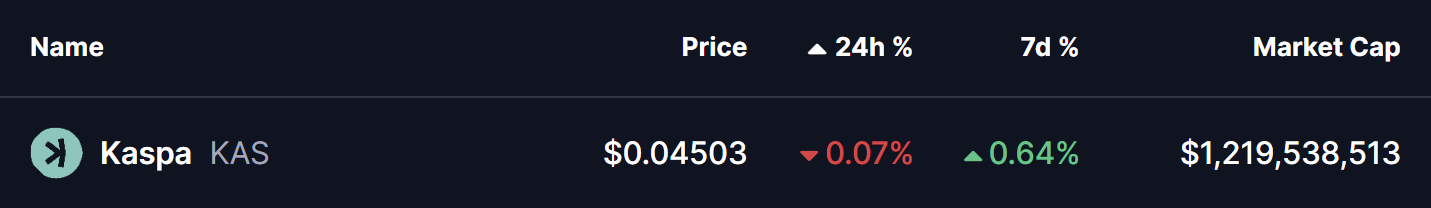
Source: Coinmarketcap
Rounding Bottom in Play
On the 4-hour timeframe, Kaspa appears to be forming a rounding bottom pattern, a classic bullish reversal structure that typically develops after a prolonged corrective phase. This pattern reflects a slow but steady transition from distribution to accumulation, as selling pressure weakens and buyers gradually regain control.
The setup began after KAS faced strong rejection near the $0.06310 neckline zone, which triggered a sharp decline through late November and December. That downside move eventually found strong demand near the $0.040 level, which has since acted as a key support area. Multiple defenses of this zone prevented further downside and helped establish a stable base for a potential trend reversal.
Since carving out that bottom, KAS has started to curve higher in a smooth, rounded fashion — closely matching the textbook structure of a developing rounding bottom. The recent stabilization above the $0.045 region further supports the idea that downside momentum is fading.
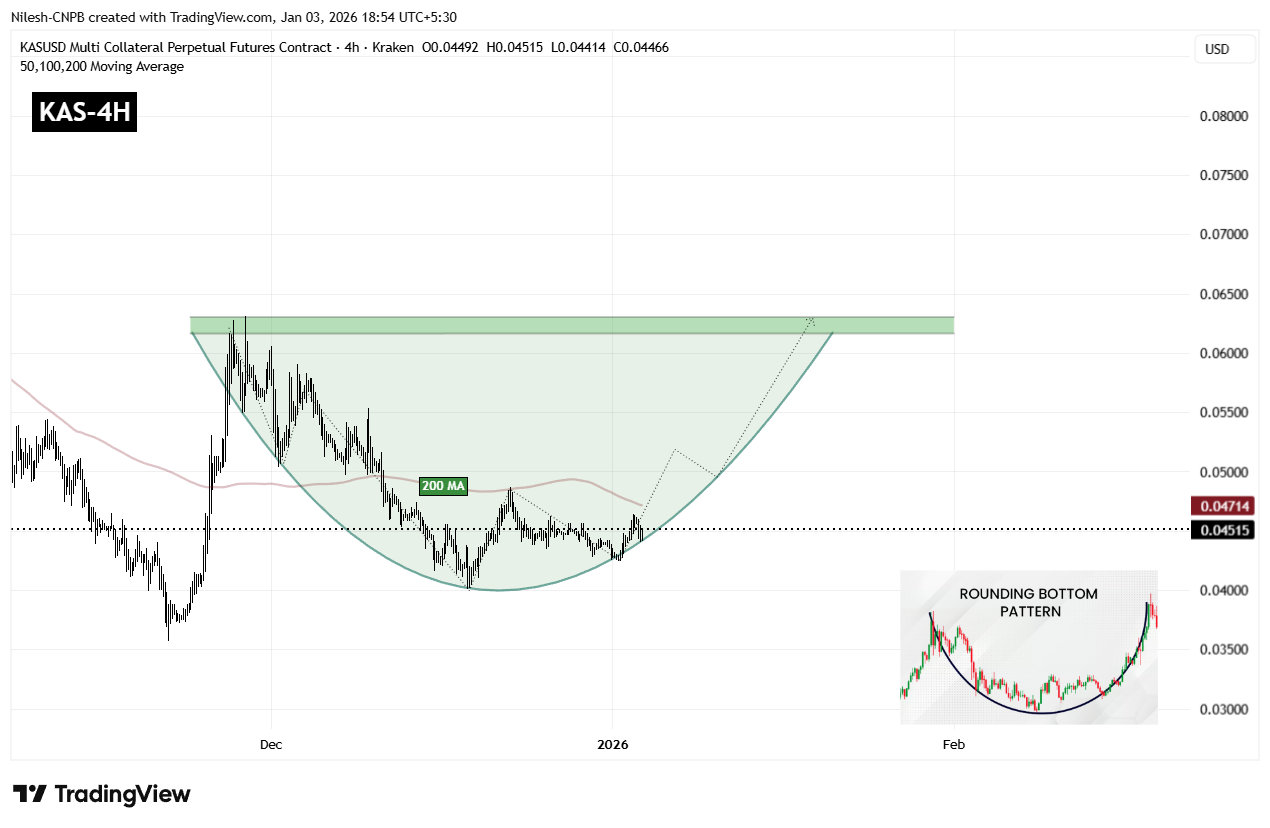
Kaspa (KAS) 4H Chart/Coinsprobe (Source: Tradingview)
A key technical level now comes into focus: the 200-period moving average, currently hovering near $0.04714. This level has acted as dynamic resistance during the recovery phase, and reclaiming it would mark an important shift in short-term market structure.
A sustained move above the 200 MA would indicate that buyers are regaining control after months of corrective price action and could act as the trigger for a stronger upside continuation.
What’s Next for KAS?
For full confirmation of the rounding bottom pattern, KAS must eventually reclaim the $0.06310 neckline resistance. A clean breakout above this zone would validate the entire reversal structure and could open the door to a broader bullish expansion phase, with momentum traders likely re-entering the market.
Until that breakout occurs, the pattern remains in development. Short-term consolidation or shallow pullbacks remain possible, especially near moving average resistance. However, as long as price continues to hold above the $0.04245 support base and maintains higher lows, the broader bottoming structure remains intact and constructive.
In the near term, all eyes remain on the 200 MA and the neckline zone. How Kaspa reacts around these levels will likely determine whether this emerging bullish setup evolves into a confirmed breakout move or requires more time to mature.
Disclaimer: The views and analysis presented in this article are for informational purposes only and reflect the author’s perspective, not financial advice. Technical patterns and indicators discussed are subject to market volatility and may or may not yield the anticipated results. Investors are advised to exercise caution, conduct independent research, and make decisions aligned with their individual risk tolerance.
About Author: Nilesh Hembade is the Founder and Lead Author of Coinsprobe, with over 5 years of experience in the cryptocurrency and blockchain industry. Since launching Coinsprobe in 2023, he has been providing daily, research-driven insights through in-depth market analysis, on-chain data, and technical research.

Disclaimer: The information on this page may come from third parties and does not represent the views or opinions of Gate. The content displayed on this page is for reference only and does not constitute any financial, investment, or legal advice. Gate does not guarantee the accuracy or completeness of the information and shall not be liable for any losses arising from the use of this information. Virtual asset investments carry high risks and are subject to significant price volatility. You may lose all of your invested principal. Please fully understand the relevant risks and make prudent decisions based on your own financial situation and risk tolerance. For details, please refer to
Disclaimer.
Related Articles
Ethereum Liquid Supply Hits 2024 Low on Binance
Abstract: CryptoQuant reports a notable contraction in Ethereum's liquid supply on Binance, with liquid ETH dropping to about 534,000 from a total reserve of 3.44 million. The trend, termed liquidity dryup, could reduce near-term selling pressure and provide price support if demand improves.
Summary: CryptoQuant notes Binance's ETH liquid supply fell to ~534k of 3.44M total, signaling a liquidity dryup that could ease selling pressure and support prices if demand strengthens.
CryptoFrontier43m ago
$78,000 BTC Price Support Level Reclaimed, Bitcoin Could Be Entering Bullish Reversal Stage
Bitcoin reclaiming $78k fuels a bullish reversal narrative and potential altseason, with bulls eyeing new ATHs up to $126k–$140k while bears warn of a fake pump before a cycle bottom.
Abstract: The article discusses Bitcoin reclaiming the $78,000 level as a potential bullish reversal that could spur altcoin rallies, outlining bullish and bearish forecasts, possible new ATHs, and rising market optimism.
CryptoNewsLand53m ago
Altcoin Trading Volume Share Hits Two-Month High at 51% on Major CEX
Gate News message, April 22 — According to analyst Darkfost, altcoin trading volume share on a major centralized exchange reached 51%, up significantly from 31% in early March, while Bitcoin and Ethereum shares fell to 30% and 17% respectively.
Ethereum's trading volume share declined sharply from
GateNews1h ago
Bitcoin Breaks Through $78,000, Ethereum Hits $2,390: Market Panic Eases
Bitcoin breaks through $78,000, while Ethereum climbs above $2,390. This article reviews the V-shaped reversal trend from April 13 to 22, analyzing the evolution of liquidation data and the Fear and Greed Index.
GateInstantTrends2h ago
SHIB Struggles to Recover as Fresh Developments Fail to Lift Price Action
SHIB trading activity rises, but price stays trapped in a tight consolidation range.
Whale accumulation increases while some long-term holders, including Aoki, exit positions.
Strong derivatives volume and inflows fail
CryptoNewsLand4h ago
Macro Recovery Drives Risk Asset Inflows; Crypto Market Shows Divergence Between Mainstream and Altcoins
Global risk appetite rose on easing Middle East tensions, lower energy prices, and strong institutional support, pushing equities to new highs; gold held gains while crypto and ETFs posted modest moves.
Global risk sentiment improved as tensions eased and energy prices fell, with equities at highs, gold firm, and crypto modestly higher; regulatory steps included France backing euro stablecoins and Circle's USDC Bridge.
GateNews5h ago