
Date: Fri, Dec 26, 2025 | 06:30 PM GMT
The broader cryptocurrency market has been navigating a period of choppy and uncertain price action over the past several weeks, a phase that began after the sharp market-wide sell-off on October 10. During that correction, Ethereum (ETH) dropped nearly 28% over the last 60 days, applying sustained pressure across the altcoin sector — including ether.fi (ETHFI).
ETHFI has mirrored this weakness, sliding more than 31% over the same period. However, despite the sharp downtrend, recent price behavior suggests selling pressure may be easing. The token is now trading near a historically significant demand zone, where buyers have repeatedly stepped in before — raising the possibility that ETHFI could be approaching an inflection point.
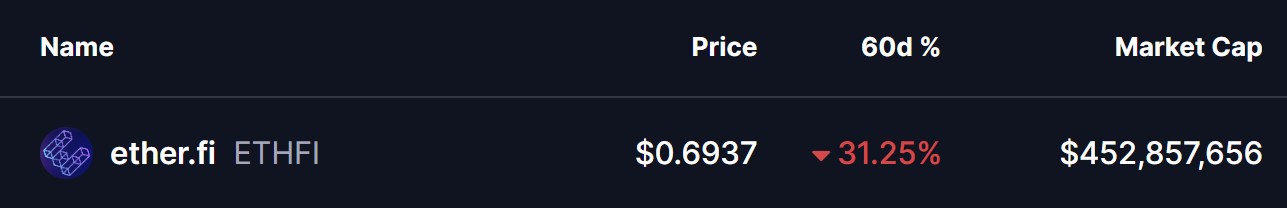
Source: Coinmarketcap
Double Bottom Pattern in Focus
On the daily timeframe, ETHFI appears to be forming a potential double-bottom structure — a classic reversal pattern that often signals exhaustion among sellers. The setup began after ETHFI was rejected from the $0.9233 resistance area, a move that triggered a sharp decline of nearly 28% and pushed price back toward the lower end of its range.
That sell-off dragged ETHFI into the $0.65 support zone, a level that has consistently acted as a strong demand area in the past. The chart now shows price revisiting this same region and stabilizing once again, suggesting buyers are actively defending it. The similarity between the first and second lows strengthens the case that a double-bottom base may be forming.
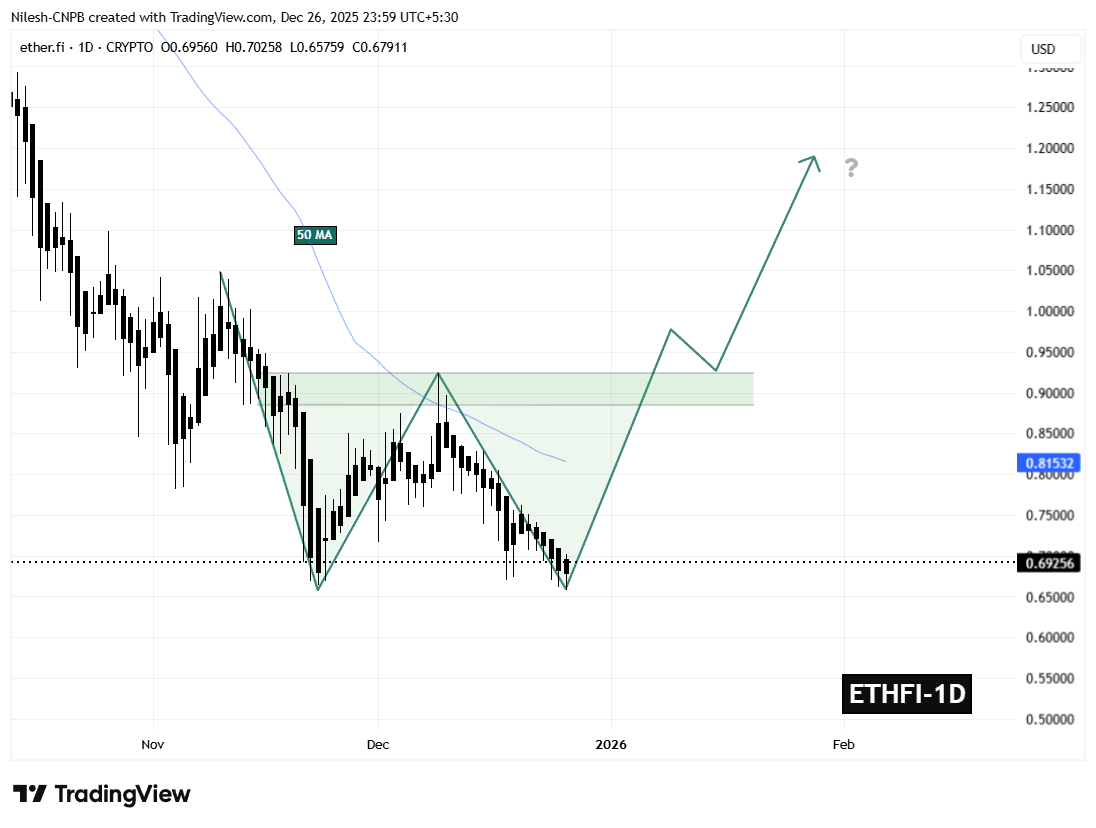
ETHFI Daily Chart/Coinsprobe (Source: Tradingview)
If this support continues to hold, the ongoing consolidation could mark the completion of the second bottom — a critical step in shifting momentum away from sellers and toward a potential trend reversal.
What’s Next for ETHFI?
The $0.65 support zone remains the most important level to monitor in the near term. As long as ETHFI holds above this area, the developing bullish structure remains valid and provides room for momentum to gradually rebuild.
On the upside, the first major challenge sits at the 50-day moving average near $0.8153. This level has repeatedly capped recovery attempts throughout the recent downtrend and now represents the initial test for buyers. A sustained move above this moving average would signal improving market structure and growing bullish confidence.
Beyond that, the $0.9233 neckline stands as the key confirmation level. A decisive breakout above this resistance would complete the double-bottom pattern and significantly strengthen the bullish outlook, potentially opening the door for a broader recovery move in the weeks ahead.
For now, ETHFI finds itself at a technically pivotal zone — one that could either reinforce the existing downtrend or mark the beginning of a meaningful rebound if buyers continue to defend support.
Disclaimer: The views and analysis presented in this article are for informational purposes only and reflect the author’s perspective, not financial advice. Technical patterns and indicators discussed are subject to market volatility and may or may not yield the anticipated results. Investors are advised to exercise caution, conduct independent research, and make decisions aligned with their individual risk tolerance.
Disclaimer: The information on this page may come from third parties and does not represent the views or opinions of Gate. The content displayed on this page is for reference only and does not constitute any financial, investment, or legal advice. Gate does not guarantee the accuracy or completeness of the information and shall not be liable for any losses arising from the use of this information. Virtual asset investments carry high risks and are subject to significant price volatility. You may lose all of your invested principal. Please fully understand the relevant risks and make prudent decisions based on your own financial situation and risk tolerance. For details, please refer to
Disclaimer.
Related Articles
BSC Chinese meme coins surge across the board, as CZ’s tweet sparks a “Crypto Summer” craze
On April 13, Chinese meme coins across the BSC chain rose across the board, led by “Binance Life,” with a weekly gain of up to 360% and an intraday increase of over 45%. CZ’s post sparked resonance with “Crypto Summer,” energizing sentiment across the entire sector. Although market sentiment has surged in the short term, the high volatility and liquidity risks of meme coins cannot be ignored, and investors need to be cautious.
MarketWhisper1h ago
Bittensor founder accuses former brother of betrayal; TAO’s sudden plunge sparks 9.1 million liquidations
Bittensor co-founder Jacob Steeves accuses Covenant AI’s Simon Dare of intentionally causing damage to the agreement, leading to a sharp drop in TAO tokens. Steeves proposes a locked-staking mechanism that uses on-chain code to enforce commitments and prevent founders from making sudden, surprise exits. Even as the crisis unfolds, Bittensor’s open-source architecture can still ensure the agreement continues to operate, and it is set to hold a meeting to introduce the new mechanism.
MarketWhisper1h ago
Bloomberg strategist Mike McGlone: a crypto bear market or at the early stage, with Bitcoin potentially falling back to $10k
Bloomberg strategist Mike McGlone says the crypto bear market may be in its early stages, and Bitcoin could fall to $10k. Even though Bitcoin ETFs have matched S&P 500 ETF returns, Bitcoin ETFs have higher volatility and the valuation of underlying assets that lack real support remains elevated.
GateNews2h ago
Why is Bitcoin down today? The U.S. military blocks the Strait of Hormuz, but Iran-U.S. talks end in failure
The U.S. imposes a naval blockade on Iran, causing the U.S.-Iran nuclear talks to fall apart. Market risk sentiment intensifies, and Bitcoin drops to $71,000, with a 24-hour decline of 3.1%. Traditional market capital flows into safe-haven assets, and analysts are divided on Bitcoin’s future trend, with $70,000 support acting as a key level.
MarketWhisper2h ago
The Crypto Fear and Greed Index drops to 12, and the market is in extreme fear
Gate News message, April 13. According to Alternative.me data, today the Crypto Fear and Greed Index is 12, down further from yesterday’s 16, with the market in an “extreme fear” state. This index evaluates market sentiment across multiple dimensions, including volatility, market trading volume, social media, market surveys, Bitcoin’s share of the overall market, and Google Trends keyword analysis. The lower the number, the greater the level of fear.
GateNews3h ago
ETH 15-minute drop of 0.66%: short-term holders selling off in tandem with exchange net inflows amplifies the selling pressure
2026-04-12 22:00 to 22:15 (UTC), ETH showed a clear downward move in a highly liquid environment. The candlestick chart indicates a return of -0.66%, with price fluctuations ranging from 2186.76 to 2211.25 USDT, and a swing amplitude of 1.11%. Market attention rose rapidly, short-term sentiment turned cautious, and volatility intensified.
The main driving factors behind this unusual move are a sharp increase in exchange net inflows and concentrated selling by short-term holders. On-chain data shows that over the past 24 hours, net inflow of ETH into exchanges totaled 9,567.65 ETH, suggesting that a large amount of capital entered the market in the short term, potentially increasing selling pressure.
GateNews5h ago
