
Date: Sun, Dec 21 2025 | 10:26 AM GMT
The broader cryptocurrency market has continued to struggle with uneven and choppy price action over the past several weeks, a phase that began after the sharp sell-off on October 10. That correction pushed Ethereum (ETH) lower by nearly 26% over the last 60 days, keeping sustained pressure across the altcoin market. **Stellar (XLM) **has been no exception, remaining under selling pressure as risk appetite across the sector stays muted.
**XLM **is down more than 29% over the past two months, but beneath the surface, the weekly chart is starting to reveal a technical structure that could lay the groundwork for a potential rebound if key levels continue to hold.
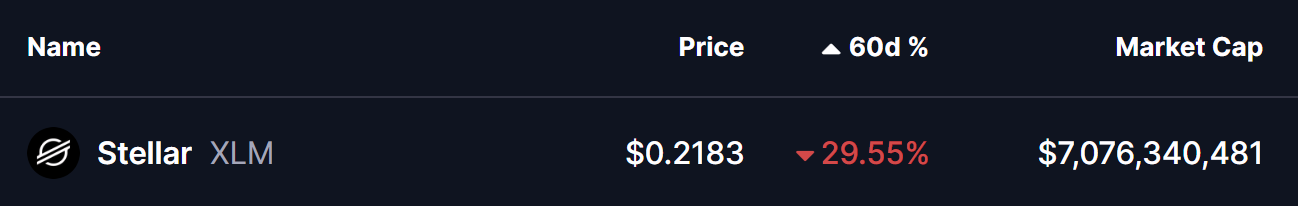
Source: Coinmarketcap
Descending Triangle Structure Comes Into Focus
On the weekly timeframe, XLM has been trading within a large descending triangle formation. This pattern is defined by a series of lower highs pressing against a relatively flat support base, reflecting consistent selling pressure from the top while buyers defend the same demand zone below. While descending triangles are often viewed as bearish continuation structures, repeated defenses of the base can also precede sharp upside reactions, particularly when broader market sentiment is already pessimistic.
The chart shows XLM once again pulling back into the critical $0.20–$0.22 support region. This zone has acted as a reliable demand area throughout the year, with each visit producing long lower wicks and swift reactions from buyers. These candle structures suggest that accumulation is taking place, even as price continues to respect the descending trendline from above. Despite months of pressure, sellers have so far been unable to force a decisive breakdown below this floor.
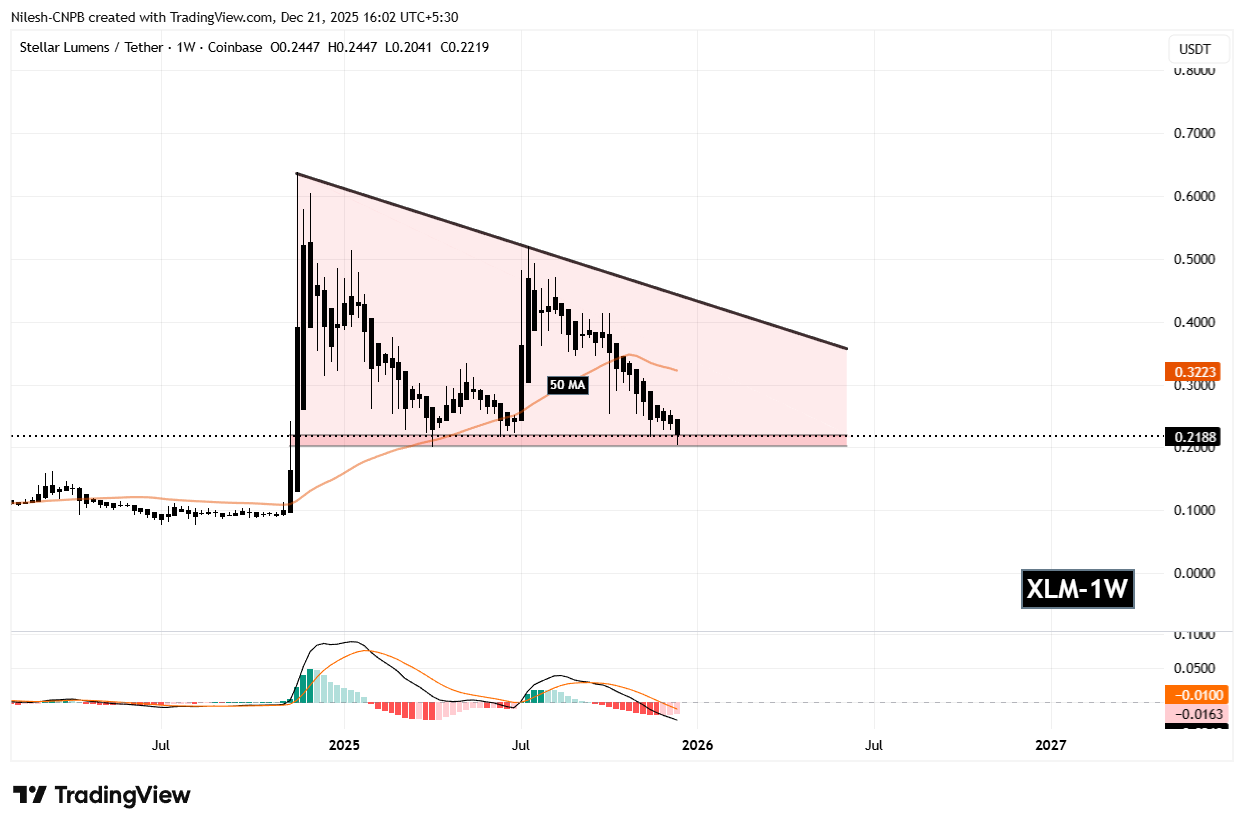
Stellar (XLM) Daily Chart/Coinsprobe (Source: Tradingview)
At the same time, XLM is trading below its 50-week moving average, currently near the $0.32 region. This moving average has historically marked important shifts in trend direction, and price behavior around it often determines whether rallies can gain traction or fade quickly.
What’s Next for XLM?
As long as the $0.20–$0.22 support zone remains intact, the probability of a rebound stays firmly on the table. A sustained defense of this level could allow XLM to stabilize and attempt a move back toward the descending trendline resistance near $0.32. This area aligns closely with the 50-week moving average, making it a key zone that bulls would need to reclaim to signal improving market structure.
A decisive weekly close above the descending trendline would be a notable technical development. Such a move would invalidate the bearish bias of the triangle and could open the door for a broader trend reversal, especially if accompanied by rising volume and improving momentum across the wider crypto market.
That said, the downside risk remains clearly defined. A weekly close below the $0.20 support would confirm a breakdown from the triangle and could expose XLM to deeper declines, with the next major support area sitting closer to the $0.13 region.
For now, Stellar sits at a pivotal inflection point. With price pressing against long-term support and sellers struggling to force a breakdown, the coming weeks are likely to be decisive in determining whether XLM can stage a meaningful rebound or extend its broader corrective trend.
Disclaimer: The views and analysis presented in this article are for informational purposes only and reflect the author’s perspective, not financial advice. Technical patterns and indicators discussed are subject to market volatility and may or may not yield the anticipated results. Investors are advised to exercise caution, conduct independent research, and make decisions aligned with their individual risk tolerance.
Disclaimer: The information on this page may come from third parties and does not represent the views or opinions of Gate. The content displayed on this page is for reference only and does not constitute any financial, investment, or legal advice. Gate does not guarantee the accuracy or completeness of the information and shall not be liable for any losses arising from the use of this information. Virtual asset investments carry high risks and are subject to significant price volatility. You may lose all of your invested principal. Please fully understand the relevant risks and make prudent decisions based on your own financial situation and risk tolerance. For details, please refer to
Disclaimer.
Related Articles
Why Is Bitcoin Up Today? Hormuz Blockade Triggers Short Squeeze and a BTC Test of $75k
On April 13, Bitcoin rose from its early-session low of 70,741 to trade as high as $74,900 during the session, approaching the $75,000 level. The main drivers came from two directions: after Trump ordered the blockade of the Strait of Hormuz, traders began to view Bitcoin as a geopolitical hedge asset; and a massive net short position that had been building as funding rates stayed persistently negative was met with liquidation, triggering a chain of liquidations totaling millions of dollars near the $70,000 support level.
MarketWhisper1h ago
Bitmine gets promoted to the NYSE main board! Tom Lee: U.S. stocks may have bottomed out, and Ether’s selling pressure may ease
Bitmine has officially moved from the NYSE American board to the main board in the United States, marking an important milestone for the company. Despite a sharp drop in its stock price, it has still increased its share repurchase authorization to $4.0 billion. The company holds a large amount of Ether, and it predicts that a rebound in the crypto market will help boost its assets and stock price performance.
CryptoCity2h ago
U.S. stocks have recovered the losses since the Iran war, while Bitcoin pushes up to 74K
Due to market expectations that the United States and Iran will reach an agreement, the S&P 500 index has rebounded to its highest level since the war, and Bitcoin has also surged to $74,900. Despite the failure of peace talks between the U.S. and Iran, the U.S. has imposed a maritime blockade to pressure Iran. MicroStrategy once again made a large-scale purchase of Bitcoin, indicating that investor confidence is picking up.
ChainNewsAbmedia2h ago
BTC 15-minute surge up 0.77%: Spot buy-side demand and on-chain activity convergence drive short-term strength
2026-04-13 22:00 to 2026-04-13 22:15 (UTC), the BTC price fluctuated upward within 15 minutes, with a return of +0.77%. The high and low prices in the range were between 73178.0 and 73899.0 USDT, and the amplitude was 0.99%. During the event, market attention increased, volatility slightly intensified, and overall sentiment leaned positive.
The main driver behind this price deviation was active spot market buy orders stepping in, which pushed the BTC price higher in the short term. The number of active addresses on-chain remained at a high level, reflecting an increase in genuine trading demand. Trading volume was higher than in the previous period,
GateNews4h ago
Bitmine gets promoted to the NYSE main board! Tom Lee: US stocks may be bottoming out, and sell pressure on Ether could ease
Bitmine has officially moved from the NYSE American board to the main board in the United States, marking an important milestone for the company. Despite a sharp drop in its share price, it has still increased the share repurchase plan amount to $4.0 billion. The company holds a large amount of Ether, and it expects that a rebound in the crypto market will help improve its assets and share price performance.
CryptoCity5h ago
