Monad (MON) has recorded an increase of over 19% in just the past 24 hours, indicating that speculative capital is returning to the market, although profit-taking pressure has already started to emerge.
The current price movement shows that MON is in a positive recovery trend. However, the daily increase is not entirely random but supported by several key factors from both market psychology and short-term capital flows. The question is whether Monad has enough momentum to sustain this upward trend, or if this is just a short-term euphoric phase after the launch?
Why is Monad rising today?
According to data from Artemis, the network activity of MON reflects a mixed market sentiment, but slightly leaning towards an upward trend.
The latest indicators show that the network has recovered significantly from the bottom set on 12/11. Over the past week, both daily active users and new users have increased, although the active user group still accounts for the majority.
Specifically, the average number of active users is around 76,000, while new users number about 24,000. On-chain activity is also lively, with over 1.6 million transactions per day.
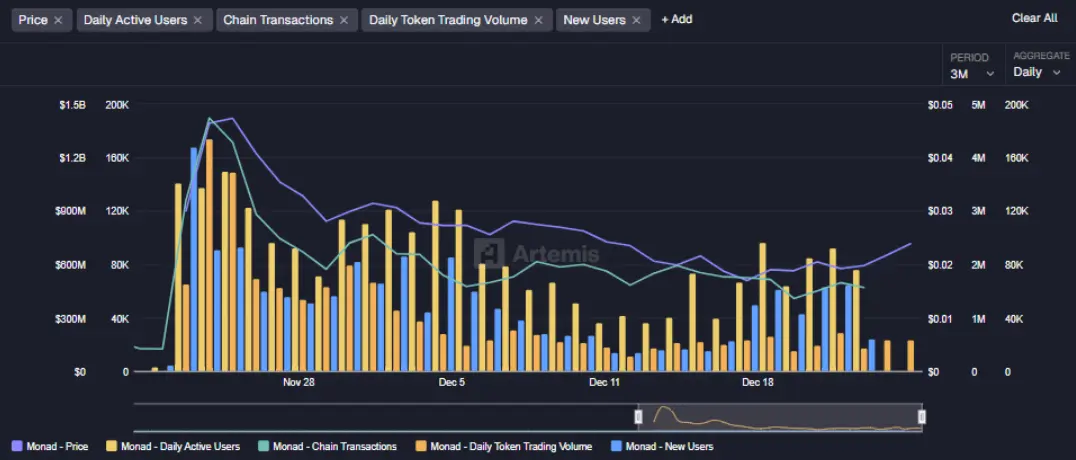 Source: Artemis Although these indicators are fluctuating relatively stably around the current level, they are still noticeably higher than last week, providing a foundation to support the price trend. In fact, the price movement of MON has closely reflected the improving pace of network activity.
Additionally, Monad’s integration of the USD1 stablecoin has helped increase liquidity for the ecosystem, making MON’s price volatility more prominent and pushing this token into the group of double-digit growth cryptocurrencies in a single day.
Finally, the implementation of staking on exchanges also plays an important role in limiting potential supply. When a large amount of tokens are locked and not circulating, buying pressure on the remaining tokens in the market is consequently reinforced.
Can MON sustain its upward momentum?
On the technical chart, Monad (MON) has officially broken out of the converging triangle pattern after a prolonged accumulation phase since 12/18. Notably, this breakout has been strong in recent 24 hours, indicating a clear change in market momentum.
Technical signals are leaning towards a positive trend: RSI shows bullish divergence, while Bollinger Bands are expanding, reflecting increased volatility and confirming that the bulls (bull) are in control. This also explains the explosive price increase immediately after the pattern was broken.
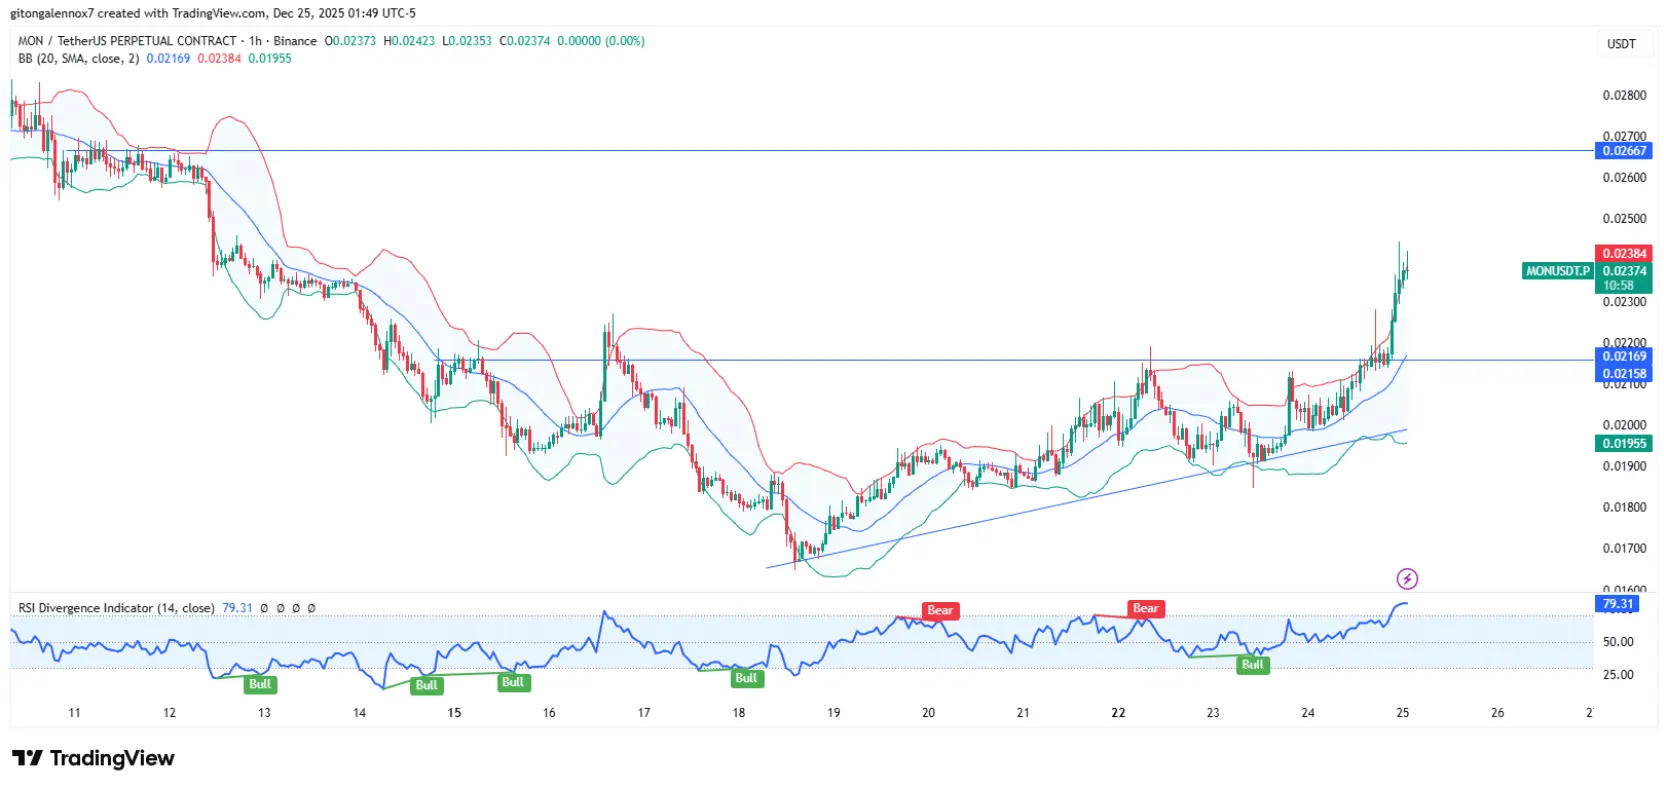 Source: TradingView The price maintaining stability above the support zone of $0.02169 opens up room for MON to target the next goal at $0.02667. However, a short-term correction cannot be ruled out, aiming to “shake out” weak positions before establishing a clearer trend.
Can MON maintain its upward momentum after this potential correction? The developments in the next few sessions, along with overall market sentiment, will play a crucial role in determining the answer.
Capital inflow into the ecosystem
In the overall market picture, Monad emerges as the third-largest selling token among new cryptocurrency projects in 2025. The project has generated over $217 million in revenue, reflecting significant appeal and strong capital inflows into this ecosystem.
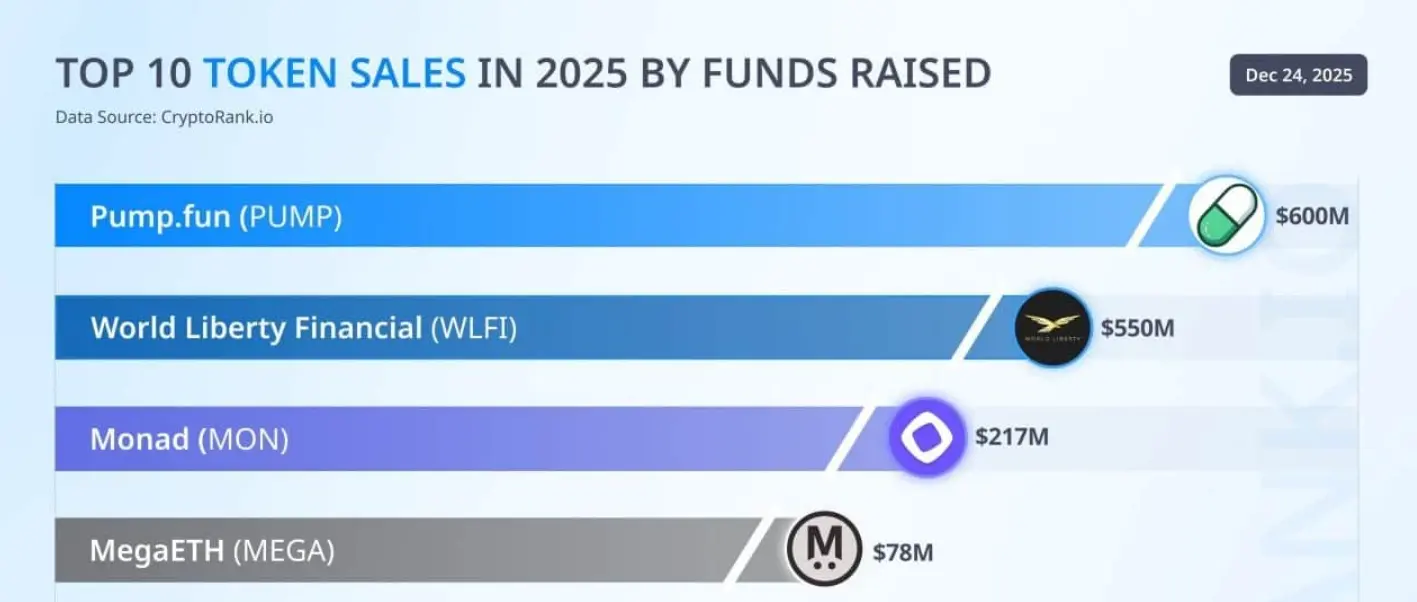 Source: Wu Blockchain Notably, a considerable portion of this capital comes from new investors, as mentioned in previous analyses. However, the scale of this new user group is still modest, indicating substantial growth potential in the near future.
Disclaimer: The information on this page may come from third parties and does not represent the views or opinions of Gate. The content displayed on this page is for reference only and does not constitute any financial, investment, or legal advice. Gate does not guarantee the accuracy or completeness of the information and shall not be liable for any losses arising from the use of this information. Virtual asset investments carry high risks and are subject to significant price volatility. You may lose all of your invested principal. Please fully understand the relevant risks and make prudent decisions based on your own financial situation and risk tolerance. For details, please refer to
Disclaimer.
Related Articles
BTC 15-minute rise of 0.53%: Institutional derivatives adding positions drives a short-term rebound
Between 2026-04-20 01:30 and 2026-04-20 01:45 (UTC), the BTC spot price fluctuated within a narrow range of 74290.9 to 74709.7 USDT. Over the 15-minute period, the return was +0.53%, with a range of 0.56%. Overall market volatility increased, drawing attention, but the number of active on-chain addresses remained steady, with no sign of extreme capital movements.
The main driver behind this move is institutional capital inflows into mainstream futures platforms and adjustments to derivatives position structures, especially CME futures open interest (OI), which rose against the trend by 2.61%. Meanwhile, some institutions added to defensive hedges and positioned for short-term rebounds within the price consolidation range. In addition, short-term Put options trading on platforms such as Deribit was active: the main contracts were concentrated on near-term downside protection, indicating that derivatives capital has increased its allocation to defensive strategies and that the spot market has passively followed the upward move.
In addition, ETF funds recorded $1.87 billion in net inflows in Q1, easing the consecutive net outflow trend seen earlier before March and providing medium-term background support for spot prices. Although on-chain active addresses over 1 hour stayed in the 19500–19600 range without abnormal increases or decreases, structural behavior by institutions across the derivatives and ETF markets converged to push short-term price volatility higher. There were no signals of sell pressure from retail traders or major whales, and no large transfers or extreme liquidation events; overall momentum came from institutional-level maneuvering.
It is worth noting that the derivatives market Put/Call ratio remains on the high side. If the price cannot continue moving upward, short-term exit pressure could intensify at any time. With overall OI shrinking, the activity of leveraged funds in the market weakens. Going forward, it is important to focus on changes in derivatives positions, ETF fund flows, and the in-and-out movements of active capital on-chain in order to respond to the risk of sharp short-term volatility. For more market information, it is recommended to continuously track relevant data indicators and capital-level anomalies.
GateNewsJust Now
On-Chain Analyst ZachXBT Flags 6 Altcoins for Suspicious Price Manipulation
On-chain analyst ZachXBT flagged six altcoins (SIREN, MYX, COAI, M, PIPPIN, RIVER) for suspicious price movements akin to the RAVE token case, urging exchanges to act swiftly against market manipulation to protect retail investors.
GateNews3h ago
BTC falls 0.44% in 15 minutes: ETF fund outflows and derivatives shorts add to the slide
From 21:45 to 22:00 (UTC) on April 19, 2026, the BTC price dropped by 0.44% within 15 minutes. The candlestick range was 74,366.1 to 74,789.3 USDT, with an amplitude of 0.57%. Short-term volatility was concentrated. During this period, the trading volume for large orders rose significantly, market attention increased, and volatility intensified.
The main driving force behind this deviation was that U.S. spot Bitcoin ETFs saw a large net outflow of $291 million over two days from April 18 to April 19. This reflected institutional funds pulling away in the short term, which led to a marked increase in sell pressure in the spot market. At the same time, BTC perpetual contract
GateNews3h ago
Dogecoin Holds $0.094 as X Cashtags Drive Market Attention
Key Insights
Dogecoin holds above $0.094 despite market weakness as Bitcoin and Ethereum stabilize, reflecting resilience and sustained demand across major cryptocurrencies during the consolidation phase.
X launches smart cashtags enabling real-time crypto and stock tracking, improving marke
CryptoNewsLand6h ago
Dogecoin Holds $0.09 Support as $0.10 Breakout Looms
Dogecoin remains around $0.09, showing limited movement as traders await a clear breakout direction. Key support is at $0.08, with resistance at $0.10. Current technical indicators suggest a balanced market, but a decisive move is needed to shift momentum.
CryptoNewsLand7h ago
XRP Price Clears $1.40 While Broader Downtrend Persists
XRP's recent rise above $1.40 indicates a shift in market behavior after a consolidation phase. While momentum indicators show improvement, the broader bearish trend persists, limiting upside potential. Sustained support is crucial for extending its recovery.
CryptoNewsLand7h ago
