
Date: Tue, Dec 23, 2025 | 06:01 PM GMT
The broader cryptocurrency market has remained under pressure over the past several weeks, with the ongoing corrective phase weighing heavily on overall altcoin sentiment. Monad (MON) has also felt the impact of this weakness, as persistent selling pressure has kept price action subdued and volatile.
MON has declined by nearly 32% over the past 30 days, yet a closer look at the chart suggests that the current structure may be more constructive than it appears at first glance. Interestingly, Monad’s recent price behavior is beginning to resemble a bottoming pattern that previously played out on Hyperliquid (HYPE), a setup that eventually led to a powerful upside reversal earlier this year.
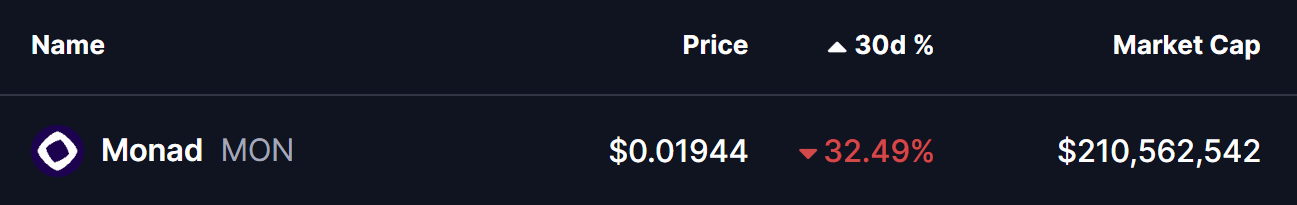
Source: Coinmarketcap
MON Mirrors HYPE’s Fractal Structure
On the comparative charts, MON appears to be tracing a structure strikingly similar to HYPE’s April 2025 fractal. In HYPE’s case, the token endured a deep 73% correction from its all-time high before forming a broadening wedge structure near the bottom. That consolidation phase ultimately resolved to the upside, with price reclaiming its key moving average and triggering a rally of more than 160% in the weeks that followed.
Monad’s decline from its own all-time high has reached roughly 65%, placing it well within the range of historical washout zones often associated with trend exhaustion. The current setup shows MON compressing within a symmetrical broadening wedge, a pattern that frequently precedes strong directional moves once price escapes the structure.

HYPE and MON Fractal Chart/Coinsprobe (Source: Tradingview)
This similarity becomes more compelling when viewed alongside the price behavior around resistance. MON is currently hovering just below a key neckline resistance band between $0.02170 and $0.02268, an area that closely mirrors the zone where HYPE consolidated before its breakout. The alignment between these two structures suggests that MON may be approaching a decision point.
What’s Next for MON?
Despite the growing resemblance to HYPE’s pre-breakout phase, the technical picture has not yet fully shifted in favor of the bulls. Sellers still retain short-term control, and confirmation is needed before a bullish reversal can be considered valid.
For momentum to flip decisively, MON would need to break above the upper boundary of the wedge and reclaim its 100 moving average, which sits near the $0.02248 level. A successful move above this region would signal improving trend strength and increase the probability that the fractal analogy continues to play out.
If such a breakout occurs, the upside potential becomes notable. A sustained bullish reversal could open the door for a broader recovery move toward the $0.049 area, which aligns with MON’s previous all-time high and represents roughly 155% upside from current levels. Until then, price action around resistance will remain critical in determining whether this fractal setup evolves into a full-fledged trend reversal or fails under continued market pressure.
**Disclaimer: **The views and analysis presented in this article are for informational purposes only and reflect the author’s perspective, not financial advice. Technical patterns and indicators discussed are subject to market volatility and may or may not yield the anticipated results. Investors are advised to exercise caution, conduct independent research, and make decisions aligned with their individual risk tolerance.
Disclaimer: The information on this page may come from third parties and does not represent the views or opinions of Gate. The content displayed on this page is for reference only and does not constitute any financial, investment, or legal advice. Gate does not guarantee the accuracy or completeness of the information and shall not be liable for any losses arising from the use of this information. Virtual asset investments carry high risks and are subject to significant price volatility. You may lose all of your invested principal. Please fully understand the relevant risks and make prudent decisions based on your own financial situation and risk tolerance. For details, please refer to
Disclaimer.
Related Articles
Bitcoin Reclaims $76,000 as US March PPI Misses Forecasts
Bitcoin surged past $76,000 following lower-than-expected US Producer Price Index data for March 2026, which indicated a 4% year-over-year increase. The rise reflects strong market support despite declining leveraged positions.
GateNews2h ago
BTC 15-minute rise of 0.64%: a technical breakout of key resistance combined with weak liquidity amplifies volatility
2026-04-14 15:30 to 15:45 (UTC), BTC saw short-term fluctuations within the 74,795.5 to 75,319.3 USDT range, with a return of +0.64% and a range of 0.70%. During this period, market attention warmed up, volatility intensified, trading volume rose slightly compared with the previous hour, and short-term buy orders pushed the price upward quickly.
The main driver of this unusual move was BTC’s short-term technical breakout above the 74,000 USDT key resistance, which generated a long signal and triggered rapid responses from quantitative and programmatic buy orders. At the same time, because the order book depth has been rising since 2025
GateNews2h ago
ETH rose 1.06% in 15 minutes: global political stimulation and a coordinated boost to risk appetite and on-chain activity together drove the move
From 15:30 to 15:45 (UTC) on 2026-04-14, the ETH price range was 2340.75 to 2367.0 USDT. Within 15 minutes, the return rate reached +1.06%, and the amplitude was 1.12%. Market volatility intensified, and on-chain and social attention rose in tandem. Short-term trading activity increased significantly, and investor sentiment shifted to optimism.
The main driving force behind this market move is the direct impact of an international political event on risk appetite. The United States announced a blockade of the Strait of Hormuz in the Middle East region related to the White House, creating a stark contrast with peace signals reportedly coming from Iran, and it triggered uncertainty and panic sentiment in the market.
GateNews2h ago
Bitmine gets promoted to the NYSE main board! Tom Lee: US stocks may be at a bottom, with selling pressure on Ether easing
Bitmine has officially moved from the NYSE American board to the main board, marking an important milestone for the company. Despite a sharp decline in its stock price, it has still increased the share repurchase plan to $4 billion. The company holds a large amount of Ether, and it expects that a rebound in the crypto market will help enhance its assets and stock price performance.
CryptoCity2h ago
Bitcoin Reclaims $75,000 for Second Time Since US-Iran Conflict, Up 7% in 24 Hours
Bitcoin surged to $75,000 amid rising U.S.-Iran tensions, adding $98 billion to its market cap and causing $500 million in liquidations. Technical analysts suggest that holding support above $67,000 could lead to an increase toward $80,000, despite highlighting $50,000 as a critical level if support fails.
GateNews2h ago
Crypto market splits as RaveDAO soars 200% while Polkadot, Zcash slide
RaveDAO jumps over 200% while Polkadot, Zcash and Dash slide, underscoring how idiosyncratic token stories now dominate a crypto market still digesting macro shocks and regulatory risk.
Summary
RaveDAO leads today's large‑cap crypto movers with a gain of more than 200%, while several majors, in
Cryptonews4h ago
