Date: Fri, Dec 19 2025 | 12:45 PM GMT
The broader cryptocurrency market is showing relative strength despite concerns around the Japan rate hike. Cooling U.S. inflation has helped both Bitcoin (BTC) and Ethereum (ETH) hold in the green, and this stability is beginning to spill over into select altcoins, including Stellar (XLM).
XLM has posted modest gains today, but beyond the short-term price move, the daily chart is starting to reveal an emerging technical structure that could set the stage for a more meaningful recovery if key levels continue to hold.
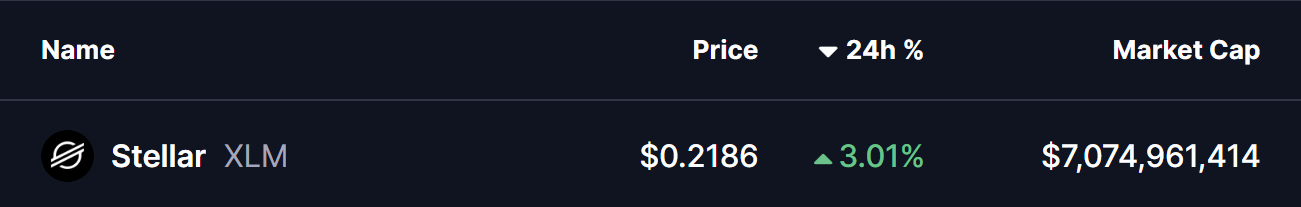
Source: Coinmarketcap
Harmonic Pattern Signals Potential Upside
On the daily timeframe, XLM appears to be forming a Bearish Cypher harmonic pattern — a setup that often generates upside momentum during its final CD leg before price reaches the Potential Reversal Zone (PRZ).
The pattern began at point X near the $0.3113 region, where XLM topped out before entering a sharp corrective phase. Price then declined into point A, followed by a rebound toward point B. From there, XLM rolled over again and extended lower into point C around the $0.2029 area, completing the core structure of the pattern.
Since tagging this low, XLM has started to stabilize and grind higher, currently trading near the $0.2188 level. This slow but steady recovery suggests that selling pressure may be fading, with buyers beginning to defend the recent lows more aggressively.
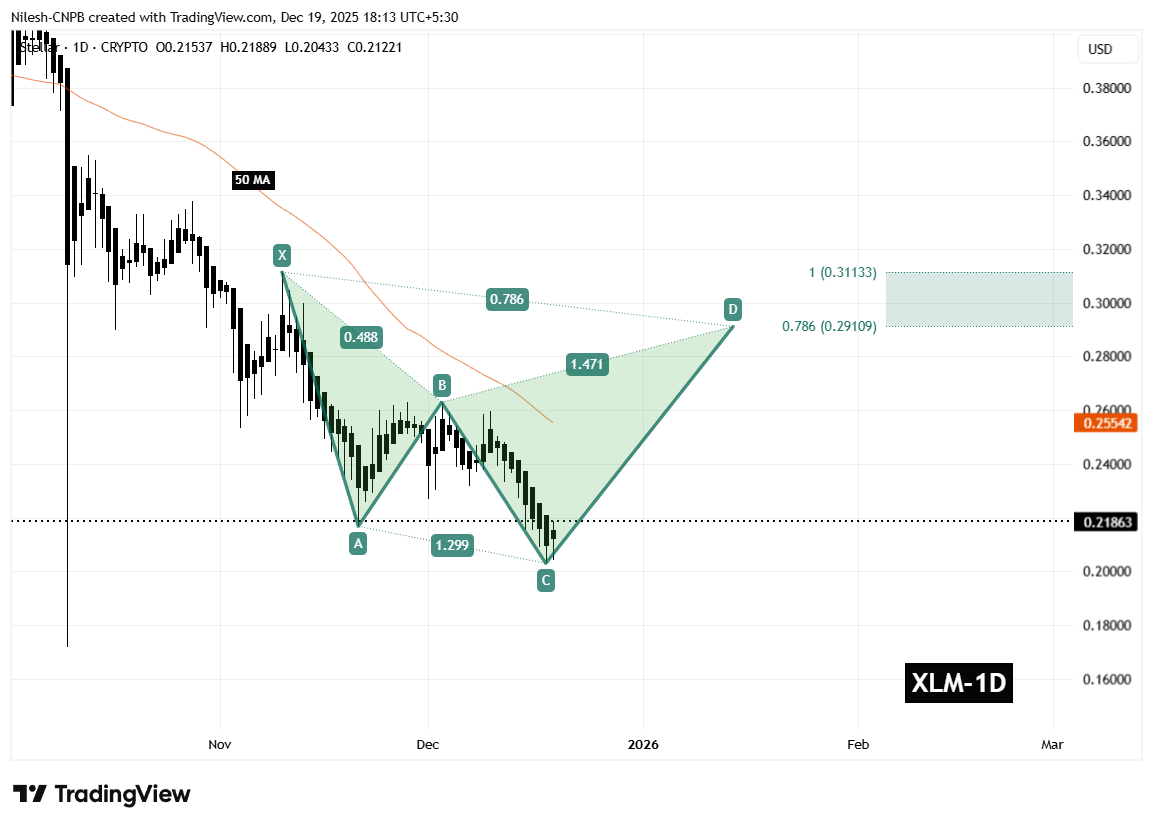
Stellar (XLM) Daily Chart /Coinsprobe (Source: Tradingview)
A key technical factor aligning with this structure is the 50-day moving average, currently positioned near $0.2554. This moving average has consistently acted as dynamic resistance throughout the downtrend and represents an important hurdle for bulls to overcome in the near term.
What’s Next for XLM?
In the short term, the most critical level to monitor is the C-leg support around $0.2029. As long as XLM holds above this zone, the harmonic pattern remains valid and the bullish CD-leg scenario stays intact.
If price continues to build strength from this base, the next major test will be a reclaim of the 50-day moving average near $0.2554. A decisive break and close above this level would signal improving momentum and could accelerate upside continuation.
Based on the harmonic structure, the projected upside targets sit within the Potential Reversal Zone, defined between the 0.786 Fibonacci extension near $0.2910 and the 1.0 extension around $0.3113. Reaching this zone would represent a potential upside of roughly 40–45% from current price levels, making it a key area where profit-taking or stronger resistance could emerge.
On the downside, failure to hold above the $0.2029 support would significantly weaken the bullish setup. A breakdown below this level could invalidate the harmonic structure and expose XLM to deeper downside pressure before any sustainable recovery attempt develops.
For now, the chart suggests Stellar is sitting at an important technical crossroads. While confirmation is still needed, the presence of a well-defined harmonic pattern indicates that a short- to medium-term bounce remains a realistic possibility if buyers continue to defend current levels and reclaim key resistance zones.
Disclaimer: The views and analysis presented in this article are for informational purposes only and reflect the author’s perspective, not financial advice. Technical patterns and indicators discussed are subject to market volatility and may or may not yield the anticipated results. Investors are advised to exercise caution, conduct independent research, and make decisions aligned with their individual risk tolerance.
Disclaimer: The information on this page may come from third parties and does not represent the views or opinions of Gate. The content displayed on this page is for reference only and does not constitute any financial, investment, or legal advice. Gate does not guarantee the accuracy or completeness of the information and shall not be liable for any losses arising from the use of this information. Virtual asset investments carry high risks and are subject to significant price volatility. You may lose all of your invested principal. Please fully understand the relevant risks and make prudent decisions based on your own financial situation and risk tolerance. For details, please refer to
Disclaimer.
Related Articles
XRP Rises 4% as Ripple Partnership and ETF Inflows Drive Recovery
XRP rose 4% to $1.41, boosted by Ripple's partnership with Kyobo Life and increasing institutional interest. Broader market gains and positive community engagement also contributed, though XRP remains 63% below its peak. Key support is at $1.38.
GateNews55m ago
ETH/BTC ratio rebounds—are institutional funds rotating? A deep dive into structural signals in the crypto market
BTC breaks through $75,000; the Iran–Israel ceasefire and fresh highs in U.S. stocks lift risk assets, but the options market remains somewhat cautious. The ETH/BTC ratio rebounds, signaling capital rotation.
GateInstantTrends2h ago
Crypto Market Rebounds 1.5% to $2.54T as Bitcoin Leads Rally Amid Tech Surge and Policy Progress
The crypto market rebounded 1.5% to $2.54 trillion, led by Bitcoin's 7% gain amid easing geopolitical tensions and strong ETF inflows. Analysts predict further gains if Bitcoin surpasses $76K resistance.
GateNews2h ago
Bitcoin bull market index rises to 40 points; Bloomberg: the U.S. and Iran are considering extending the ceasefire agreement by two weeks
Bitcoin’s price as of April 16 is approaching $74,700. The Bullish Sentiment Index (BSI) has risen to 40 points, indicating a rebound in market sentiment. The United States and Iran are evaluating options to extend the current ceasefire agreement, and they are also discussing navigation issues in the Strait of Hormuz, as diplomatic negotiations continue.
MarketWhisper8h ago
Bitcoin holds steady at 74K, and FOMO sentiment is heating up as U.S. stocks hit a record high
Benefiting from positive news about the U.S.-Iran peace agreement, the stock market surged sharply, with the Nasdaq index and the S&P 500 index reaching record highs. Bitcoin remained steady at 74K, market sentiment improved, and the Fear & Greed Index rose to 55. Investor FOMO toward the stock market intensified, and the total market capitalization in the crypto market increased overall, indicating genuine buy-side interest.
ChainNewsAbmedia9h ago
