 Crypto trader Don, also known as DonWedge, is pushing back against the growing urge to give up on altcoins. His warning comes as charts show altcoins sitting at a point that has historically mattered more than it looks at first glance.
At the center of his view is a long-term chart tracking the total crypto market cap excluding the top 10 assets. This metric is often used to gauge the health of the broader altcoin market without Bitcoin and a few large names skewing the data.
What the Altcoin chart is showing
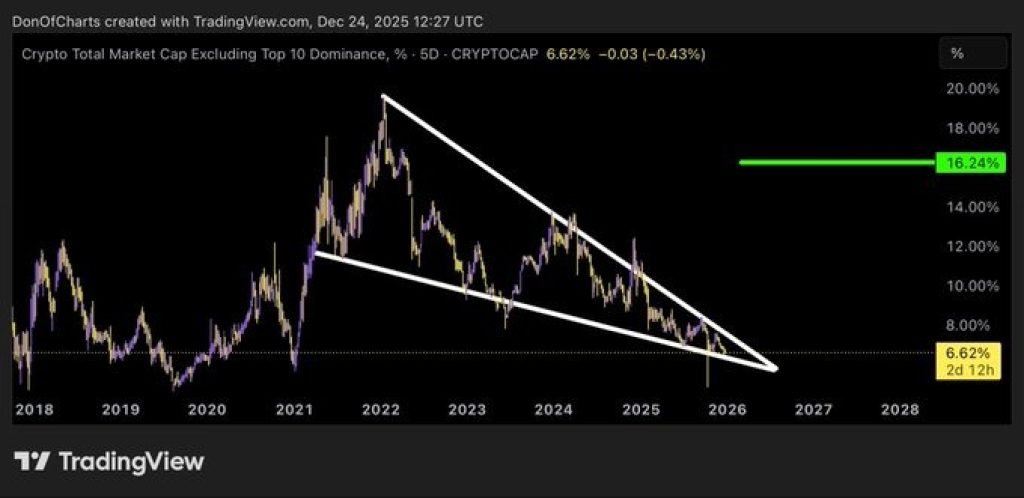
The chart stretches back to 2018 and highlights a long descending structure. Altcoins have been making lower highs for years, compressing into a narrowing wedge. That compression is now reaching its final stage, with price squeezed into the tip of the pattern.
This kind of structure usually signals that the market is running out of room. Volatility dries up, sentiment turns negative, and most participants lose interest.
That is exactly where the Altcoin chart sits now. The current reading is near 6.6%, a level that reflects how small altcoins have been pushed into a corner after years of underperformance.
What stands out is the projected upside marked on the chart. If the wedge breaks upward, the move targets the 16% zone. That would represent a major shift in relative strength back toward altcoins, similar to what happened after previous long periods of compression.
Crypto trader Don, also known as DonWedge, is pushing back against the growing urge to give up on altcoins. His warning comes as charts show altcoins sitting at a point that has historically mattered more than it looks at first glance.
At the center of his view is a long-term chart tracking the total crypto market cap excluding the top 10 assets. This metric is often used to gauge the health of the broader altcoin market without Bitcoin and a few large names skewing the data.
What the Altcoin chart is showing
The chart stretches back to 2018 and highlights a long descending structure. Altcoins have been making lower highs for years, compressing into a narrowing wedge. That compression is now reaching its final stage, with price squeezed into the tip of the pattern.
This kind of structure usually signals that the market is running out of room. Volatility dries up, sentiment turns negative, and most participants lose interest.
That is exactly where the Altcoin chart sits now. The current reading is near 6.6%, a level that reflects how small altcoins have been pushed into a corner after years of underperformance.
What stands out is the projected upside marked on the chart. If the wedge breaks upward, the move targets the 16% zone. That would represent a major shift in relative strength back toward altcoins, similar to what happened after previous long periods of compression.
Source: X/Don
Why Don says “do NOT sell” Altcoins here
From Don’s perspective, this is not a moment of strength where profits should be locked in. It is a moment of exhaustion. Long-term downtrends often end when most traders feel tired, bored, or convinced nothing will change.
Selling at this point means exiting after years of decline, just as the structure tightens and risk-to-reward starts to flip.
Historically, large altcoin rotations have started when dominance looks weak, not strong. By the time momentum feels obvious again, much of the move is already gone.
_Read Also: _****Here’s the SEI Price If Enterprises Adopt Sei Market Infrastructure Grid
Moreover, sentiment around altcoins is poor. Liquidity is thin, rallies fail quickly, and many traders have already rotated back to Bitcoin or stablecoins.
That emotional backdrop lines up with what the chart suggests: a late-stage compression rather than the start of a new collapse.
This does not guarantee an immediate breakout. These phases can drag on longer than expected. But Don’s point is simple. Selling into compression, after a multi-year downtrend, has historically been the wrong side of the trade.
However, the chart does not argue that every altcoin will win or that prices must explode tomorrow. It shows that the broader altcoin market is nearing a structural decision point. When markets reach this stage, the biggest mistake is often giving up too late.
That is why Don’s message is so direct. In his view, this is the phase where patience matters more than prediction.
Disclaimer: The information on this page may come from third parties and does not represent the views or opinions of Gate. The content displayed on this page is for reference only and does not constitute any financial, investment, or legal advice. Gate does not guarantee the accuracy or completeness of the information and shall not be liable for any losses arising from the use of this information. Virtual asset investments carry high risks and are subject to significant price volatility. You may lose all of your invested principal. Please fully understand the relevant risks and make prudent decisions based on your own financial situation and risk tolerance. For details, please refer to
Disclaimer.
Related Articles
Why is Bitcoin up today? Trump says Iran is seeking a truce, and risk assets move higher across the board
On April 15, Bitcoin rebounded about 6% after Trump said Iran is seeking to reach an agreement, breaking above $75,000. Expectations for the resumption of U.S.-Iran negotiations warmed up, lifting Asian stock markets. Technically, roughly $6 billion worth of short positions were forced to close, accelerating the rebound. Analysts said that if the U.S.-Iran situation continues to ease, Bitcoin could break through $80,000, and they predicted it may reach $150,000 by year-end.
MarketWhisper2h ago
Bitmine is promoted to the NYSE main board! Tom Lee: US stocks may be at a bottom, and selling pressure on Ether could ease
Bitmine officially transferred from the NYSE American market to the main board, marking a significant milestone for the company. Despite a sharp drop in its share price, it still increased the share repurchase program to $4 billion. The company holds a large amount of Ether, and expects that a rebound in the crypto market will help improve its assets and share price performance.
CryptoCity2h ago
ETH 15-minute up 0.66%: On-chain large transfers in sync drove a net inflow of funds, boosting spot buying pressure
2026-04-15 00:00 to 00:15 (UTC), ETH shows a local anomaly. The 15-minute return rate is +0.66%. The trading price range is 2321.93–2343.2 USDT, with a range of 0.92%. During this period, market attention increased, volatility slightly intensified, buy pressure in the order book shifted upward in the short term, and quickly pushed spot prices up into a key resistance area.
The main drivers of this anomaly are large on-chain transfers and inflows of capital in combination. At the beginning of the window, multiple large ETH transfers appeared, including 8,676 ETH and 6,551 ETH, respectively, transferring from a large source to the
GateNews3h ago
BTC 15-minute drop of 0.54%: Liquidity worsens and whales actively reduce positions, putting short-term pressure on the market
From 22:15 to 22:30 (UTC) on 2026-04-14, BTC saw a short-term pullback of 0.54% within the high-range band of 73911.6 - 74314.4 USDT, with a return of -0.54%. During this period, market swings were evident, volatility intensified, attention from the market quickly increased, and downward pressure on the order book was prominent.
The main drivers behind this unusual move were the continued deterioration of market liquidity and a clear lack of order book depth, which made the BTC price extremely sensitive to large sell orders. At the same time, during the key time window, whale wallets carried out large transfers and also engaged in active de-risking,
GateNews5h ago
ETH 15-minute drop of 0.61%: Sell orders concentrate and release while bearish sentiment intensifies, increasing downward pressure
2026-04-14 22:15 to 2026-04-14 22:30 (UTC) during this period, on the 15-minute K-line, ETH recorded a -0.61% return, with a price range of 2313.68 to 2328.54 USDT and a fluctuation of 0.64%. During this period, market attention increased, trading volume expanded noticeably, and heightened short-term volatility sparked strong interest in the subsequent trend.
The main drivers behind this unusual move are the concentrated release of sell orders and continued net outflows of on-chain funds. Specifically, the sell volume share rose to 52%, higher than the buy side at 48%, indicating heavy selling pressure
GateNews5h ago
TAO Falls 6.9% in 24 Hours as Covenant Exit and Market Rotation Weigh on Price
Bittensor's TAO token fell 6.9% to $238.91 amid a week-long decline linked to Covenant AI's exit due to centralized control concerns. Competing AI tokens had smaller declines. Despite the downturn, TAO remains the top AI token by market cap, with Grayscale increasing its allocation.
GateNews5h ago
