
The Kaspa (KAS) price has been stuck for weeks, frustrating traders looking for a clear direction. After a long decline from earlier highs, KAS is no longer accelerating lower, but it is also not breaking out.
Instead, price is hovering around the same levels, printing repeated tests of support with muted reactions.
According to analyst EliZ, this type of behavior is not random. He describes the current phase as “construction,” a period where selling pressure is absorbed rather than expanded.
- What the KAS Chart Is Showing
- Why the “Green Box” Matters For KAS Price
- KAS Price Key Levels to Watch
What the KAS Chart Is Showing
On the higher timeframes, the KAS price has been trending lower for months, but the recent structure looks different from earlier sell-offs. Price continues to dip below prior lows, yet each move is quickly bought back. There is no follow-through, no sharp continuation, and no panic expansion to the downside.
This repeated behavior suggests absorption. Sellers are still present, but they are being met by steady demand in the same area.
The Kaspa chart shows price compressing below a descending trendline, with multiple failed attempts to push lower. That compression is happening inside a clearly defined support zone, marked by the green box on the 2D chart. So far, that zone has held.

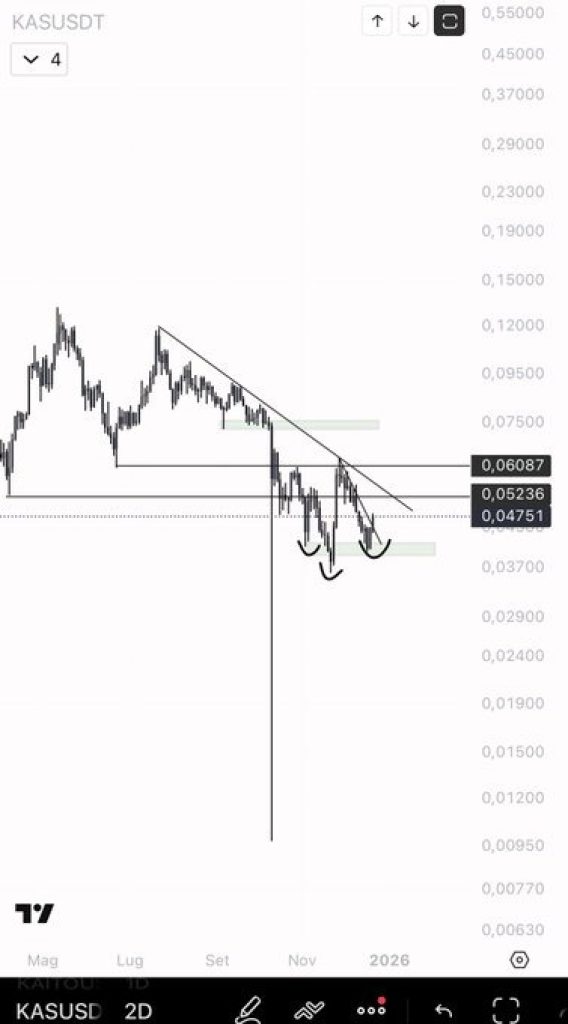
Source: X/Eliz
Why the “Green Box” Matters For KAS Price
EliZ points out that as long as the green box holds on the 2-day timeframe, the current price action remains constructive. The market is not breaking out, but it is also not collapsing. This is often how accumulation phases look before expansion begins.
In past cycles, similar Kaspa structures showed slow grinding action, small breakdowns that failed to accelerate, and long periods of boredom. When selling finally stopped, price expanded quickly and without much warning.
That does not guarantee the same outcome here, but the similarity in structure is what makes this zone important.
_Read Also: _****Here’s Why Audiera (BEAT) Price Is Pumping Today
KAS Price Key Levels to Watch
The green box acts as the main line in the sand. As long as price holds above it, the current range can be viewed as absorption rather than distribution. A sustained hold keeps the broader setup intact, even if short-term volatility continues below resistance.
If the Kaspa price loses that support decisively, the construction thesis breaks down. A clean move below the green box would invalidate the setup and likely open the door to another leg lower.
On the upside, KAS still needs to reclaim the descending trendline and previous range highs before any bullish continuation can be confirmed.
Right now, the Kaspa price is not offering clear trend signals. Instead, it is offering information. The lack of downside follow-through, combined with repeated absorption at the same levels, suggests the market is building something rather than breaking apart.
As EliZ notes, this phase does not force a move higher, but it also does not point to collapse. Until price either escapes the range or loses the green box, patience matters more than prediction. For now, KAS remains in construction mode.
Disclaimer: The information on this page may come from third parties and does not represent the views or opinions of Gate. The content displayed on this page is for reference only and does not constitute any financial, investment, or legal advice. Gate does not guarantee the accuracy or completeness of the information and shall not be liable for any losses arising from the use of this information. Virtual asset investments carry high risks and are subject to significant price volatility. You may lose all of your invested principal. Please fully understand the relevant risks and make prudent decisions based on your own financial situation and risk tolerance. For details, please refer to
Disclaimer.
Related Articles
U.S.-Iran ceasefire for 2 weeks! Bitcoin surges past $72,000, with shorts getting forcibly liquidated—liquidations exceeding $400 million.
Middle East conflict turned for the better after the U.S. and Iran agreed to a two-week ceasefire, with market risk sentiment recovering. U.S. stock index futures jumped sharply. Bitcoin broke through the $72,000 high, while oil prices plunged. Although the current rebound is significant, analysts warn that uncertainty around how the ceasefire agreement will be carried out and the overall economic pressure may still limit how long the rally can last.
区块客48m ago
CryptoQuant: Sustainable futures longs are catalyzing BTC and ETH to rise, not liquidation-triggered
CryptoQuant research indicates that after the ceasefire agreement, the price rise in Bitcoin and Ethereum was driven by new longs establishing positions, not by short liquidations. The open interest in BTC and ETH perpetual futures increased by $2.1 billion and $2.2 billion, respectively. Renewed institutional buying in the U.S. brought the Coinbase premium back into positive territory. Bitcoin broke above $69,400, targeting $79,000.
MarketWhisper1h ago
ETH 15-minute pump of 0.60%: exchange net capital outflows and on-chain large transfers drive a short-term rebound
2026-04-10 01:30 to 2026-04-10 01:45 (UTC), ETH traded within the 2185.0 to 2204.03 USDT range. The candlestick return was +0.60%, and the 15-minute intraday swing was 0.87%. During this period, mainstream market attention increased, with trading volume expanding by about 20% compared with the periods before and after, indicating stronger short-term liquidity.
The main drivers behind this unusual move were exchange net outflows and active on-chain large transfers. On-chain data shows that during this period, ETH saw multiple transactions, each over 8,000 ETH,
GateNews1h ago
Longtime Bitcoin whale dumps 271 million, replaying the crash scene from last January
Last week, Bitcoin whales sold about $271 million, setting the largest single-day activity since January. The market reacted well to this selloff: long-term holders significantly increased their Bitcoin holdings, indicating the market’s absorption capacity has strengthened. Analysts predict that Bitcoin could remain in the $70,000 to $72,000 range. Compared with the market conditions during the January selloff, this time has been more stable. Long-term holders’ net positions turned positive, and technical indicators suggest the market is approaching a bottom, with clear signs of a future recovery.
MarketWhisper1h ago
Why is Bitcoin up today? “Alireza” opens direct negotiations, and Trump demands that Iran “immediately” stop tanker fees
Bitcoin’s official rise today reached $71,800, mainly because Israel and Lebanon have begun direct negotiations, reducing market concerns about an Iran ceasefire agreement. In addition, a weaker US dollar and continued buying by institutional investors also pushed prices higher. On the technical side, Bitcoin’s key support levels are $68,500 to $70,000. A break above $76,000 to $78,000 could prompt another test of $80,000 to $85,000.
MarketWhisper2h ago
Gold falls to $4,758, the BTC Volatility Index drops 1.77%, and WTI crude oil rises 0.44%
April 10, gold and silver prices fell slightly, trading at $4,758.37 per ounce and $75.165 per ounce, respectively. The Bitcoin Volatility Index (BVIX) dropped to 44.36, and in the foreign exchange market, the U.S. dollar rose against the offshore yuan and the Japanese yen. Major European stock indexes generally declined, while WTI and Brent crude oil rose slightly. The Gate platform supports trading a variety of financial market products.
GateNews2h ago
