On Sunday, November 30, Monero (XMR) challenged the $440 resistance level. However, the previous downward momentum in the market created selling pressure on XMR.
Since this local peak, Monero has lost 10.6%, but it remains one of the few large-cap cryptocurrencies to maintain prospects for recent highs.
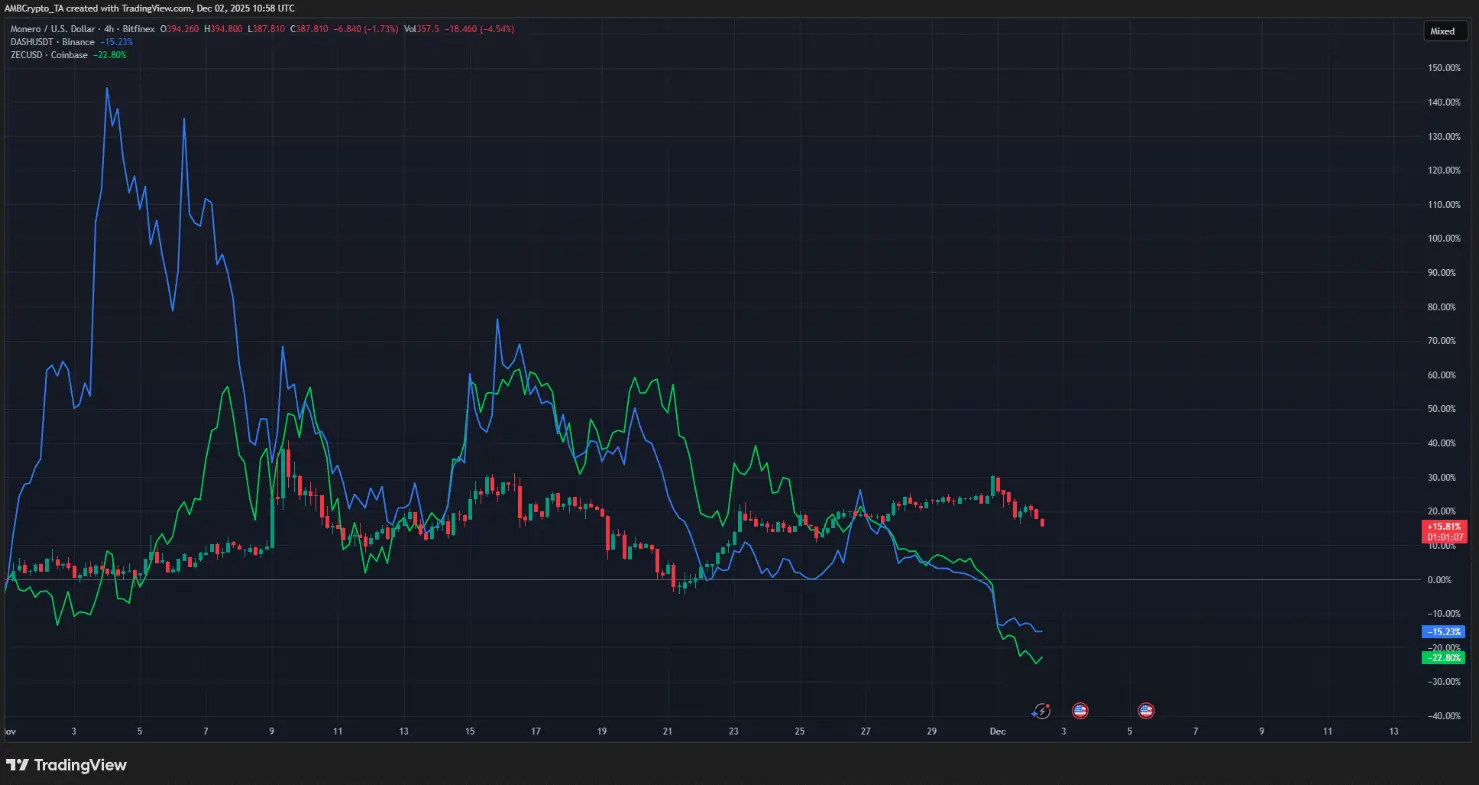 Source: TradingViewSince the beginning of November, XMR has increased by 15.8%, while the two other leading privacy coins, ZCash (ZEC) and Dash (DASH), have dropped by 22.52% and 15.23% respectively.
Although Monero has maintained stable performance in recent weeks, the long-term picture since September is still not particularly impressive: ZCash has surged 760%, while Monero has only modestly increased by 50.3%. However, with its relatively strong performance compared to the market in the past 10 days, the road ahead for XMR is opening up more opportunities for investors.
Monero trend remains positive
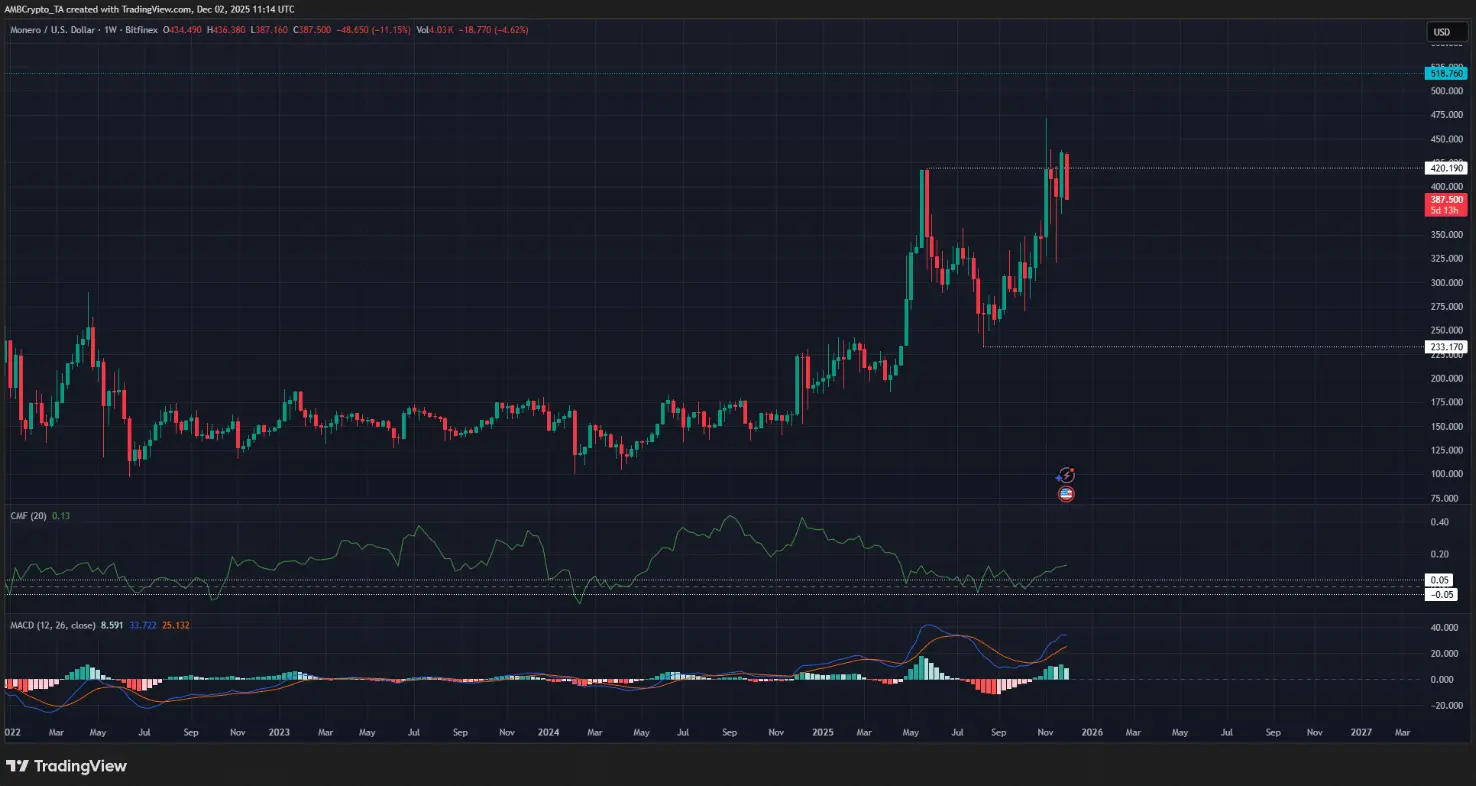 XMR/USDT weekly chart | Source: TradingViewOn the weekly timeframe, the previous peak at $420 has been broken, paving the way for a strong continuation of the uptrend. The next upside target is $518 —the all-time high from April 2021.
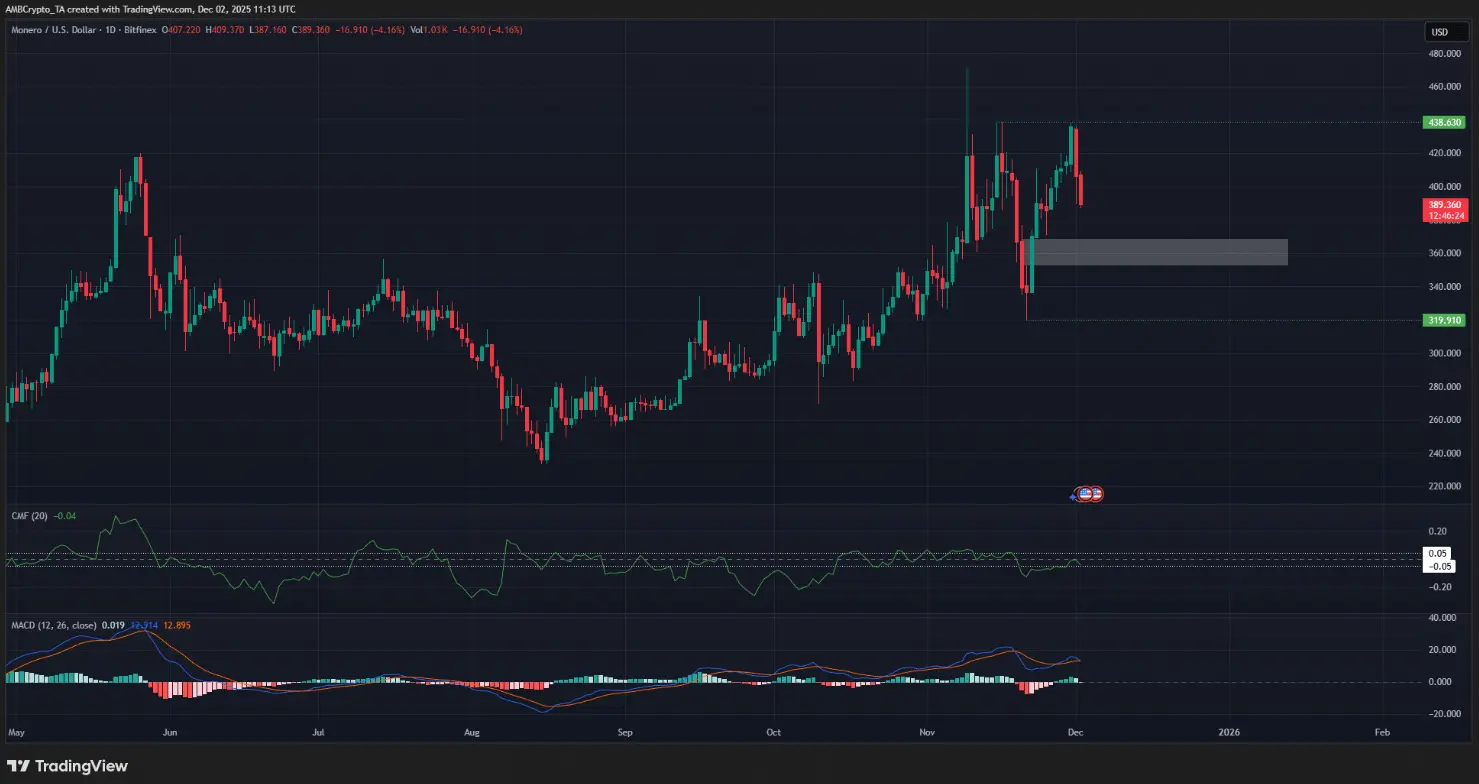 XMR/USDT daily chart | Source: TradingViewLooking at the daily chart, the swing structure still favors the bulls. The imbalance (white box) around $360 is expected to become a target in the coming days. However, the price rejection at $438 —the local peak in mid-November—is a mild warning, reminding bulls to remain cautious.
Understanding the indicators
The CMF indicator on the weekly chart records strong capital inflow, but on the daily chart, it reflects market hesitation. Similarly, the MACD shows noticeably stronger bullish momentum on the weekly timeframe compared to the daily.
 Source: CoinGlassThe liquidation map reveals that Long positions stopped out at $355 have higher total leverage compared to Short positions liquidated at $435.
This suggests that a downward move toward the $355–$360 region could occur in the short term. Conversely, above, investors should note a cluster of high-leverage Short positions concentrated around the $440–$450 area, which could create selling pressure if the price approaches this zone.
Assessing XMR’s bullish and bearish scenarios
The $233 and $320 levels serve as important support points that need to be maintained to uphold the trend. The imbalance on the daily chart, combined with signals from the liquidation map, suggests the risk of further price correction.
If a downturn occurs, the price is likely to hit the $350–$360 region, simultaneously opening an attractive buying opportunity for investors.
SN_Nour
Disclaimer: The information on this page may come from third parties and does not represent the views or opinions of Gate. The content displayed on this page is for reference only and does not constitute any financial, investment, or legal advice. Gate does not guarantee the accuracy or completeness of the information and shall not be liable for any losses arising from the use of this information. Virtual asset investments carry high risks and are subject to significant price volatility. You may lose all of your invested principal. Please fully understand the relevant risks and make prudent decisions based on your own financial situation and risk tolerance. For details, please refer to
Disclaimer.
Related Articles
BSC Chinese meme coins surge across the board, as CZ’s tweet sparks a “Crypto Summer” craze
On April 13, Chinese meme coins across the BSC chain rose across the board, led by “Binance Life,” with a weekly gain of up to 360% and an intraday increase of over 45%. CZ’s post sparked resonance with “Crypto Summer,” energizing sentiment across the entire sector. Although market sentiment has surged in the short term, the high volatility and liquidity risks of meme coins cannot be ignored, and investors need to be cautious.
MarketWhisper1h ago
Bittensor founder accuses former brother of betrayal; TAO’s sudden plunge sparks 9.1 million liquidations
Bittensor co-founder Jacob Steeves accuses Covenant AI’s Simon Dare of intentionally causing damage to the agreement, leading to a sharp drop in TAO tokens. Steeves proposes a locked-staking mechanism that uses on-chain code to enforce commitments and prevent founders from making sudden, surprise exits. Even as the crisis unfolds, Bittensor’s open-source architecture can still ensure the agreement continues to operate, and it is set to hold a meeting to introduce the new mechanism.
MarketWhisper2h ago
Bloomberg strategist Mike McGlone: a crypto bear market or at the early stage, with Bitcoin potentially falling back to $10k
Bloomberg strategist Mike McGlone says the crypto bear market may be in its early stages, and Bitcoin could fall to $10k. Even though Bitcoin ETFs have matched S&P 500 ETF returns, Bitcoin ETFs have higher volatility and the valuation of underlying assets that lack real support remains elevated.
GateNews2h ago
Why is Bitcoin down today? The U.S. military blocks the Strait of Hormuz, but Iran-U.S. talks end in failure
The U.S. imposes a naval blockade on Iran, causing the U.S.-Iran nuclear talks to fall apart. Market risk sentiment intensifies, and Bitcoin drops to $71,000, with a 24-hour decline of 3.1%. Traditional market capital flows into safe-haven assets, and analysts are divided on Bitcoin’s future trend, with $70,000 support acting as a key level.
MarketWhisper3h ago
The Crypto Fear and Greed Index drops to 12, and the market is in extreme fear
Gate News message, April 13. According to Alternative.me data, today the Crypto Fear and Greed Index is 12, down further from yesterday’s 16, with the market in an “extreme fear” state. This index evaluates market sentiment across multiple dimensions, including volatility, market trading volume, social media, market surveys, Bitcoin’s share of the overall market, and Google Trends keyword analysis. The lower the number, the greater the level of fear.
GateNews3h ago
ETH 15-minute drop of 0.66%: short-term holders selling off in tandem with exchange net inflows amplifies the selling pressure
2026-04-12 22:00 to 22:15 (UTC), ETH showed a clear downward move in a highly liquid environment. The candlestick chart indicates a return of -0.66%, with price fluctuations ranging from 2186.76 to 2211.25 USDT, and a swing amplitude of 1.11%. Market attention rose rapidly, short-term sentiment turned cautious, and volatility intensified.
The main driving factors behind this unusual move are a sharp increase in exchange net inflows and concentrated selling by short-term holders. On-chain data shows that over the past 24 hours, net inflow of ETH into exchanges totaled 9,567.65 ETH, suggesting that a large amount of capital entered the market in the short term, potentially increasing selling pressure.
GateNews6h ago
