The price of HBAR has fallen by about 6% in the past 24 hours, showing stronger pressure compared to the already weak overall trend of the crypto market. However, the technical chart is sending a rare signal: three early recovery clues that most other mid-cap coins have not yet shown.
If the overall market stabilizes again, HBAR has the potential to lead the rally, especially when this coin maintains its important support levels – details about these levels will be analyzed right after this.
Accumulation signs are forming
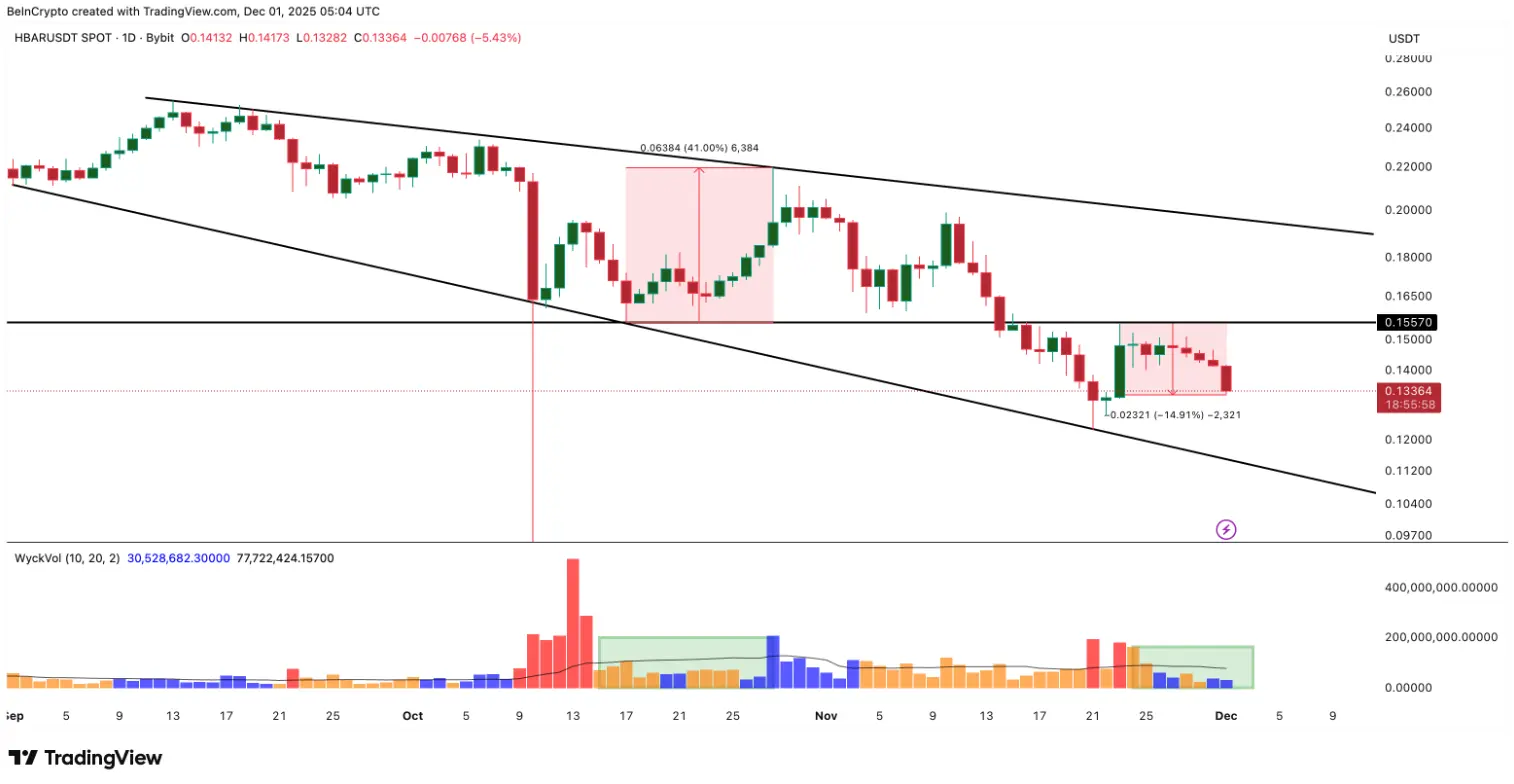
HBAR has been moving in a falling wedge pattern since early September, and this pattern often transitions to a bullish trend when sellers gradually lose control near the lower boundary. This signal first appeared around November 21.
The first clue comes from the change in trading volume behavior. According to Wyckoff's color scheme, red reflects that sellers are dominant, yellow indicates an increase in control by sellers, blue shows that buyers are starting to dominate, and green marks complete control by buyers. Since HBAR peaked at $0.155 on November 23 and fell nearly 15%, the volume bars have shifted from deep red to a mix of yellow and blue. This is a classic sign of seller exhaustion and the initial “tug of war” phase. The last time this pattern appeared — from October 15 to October 28 — HBAR surged by up to 41% immediately afterward.
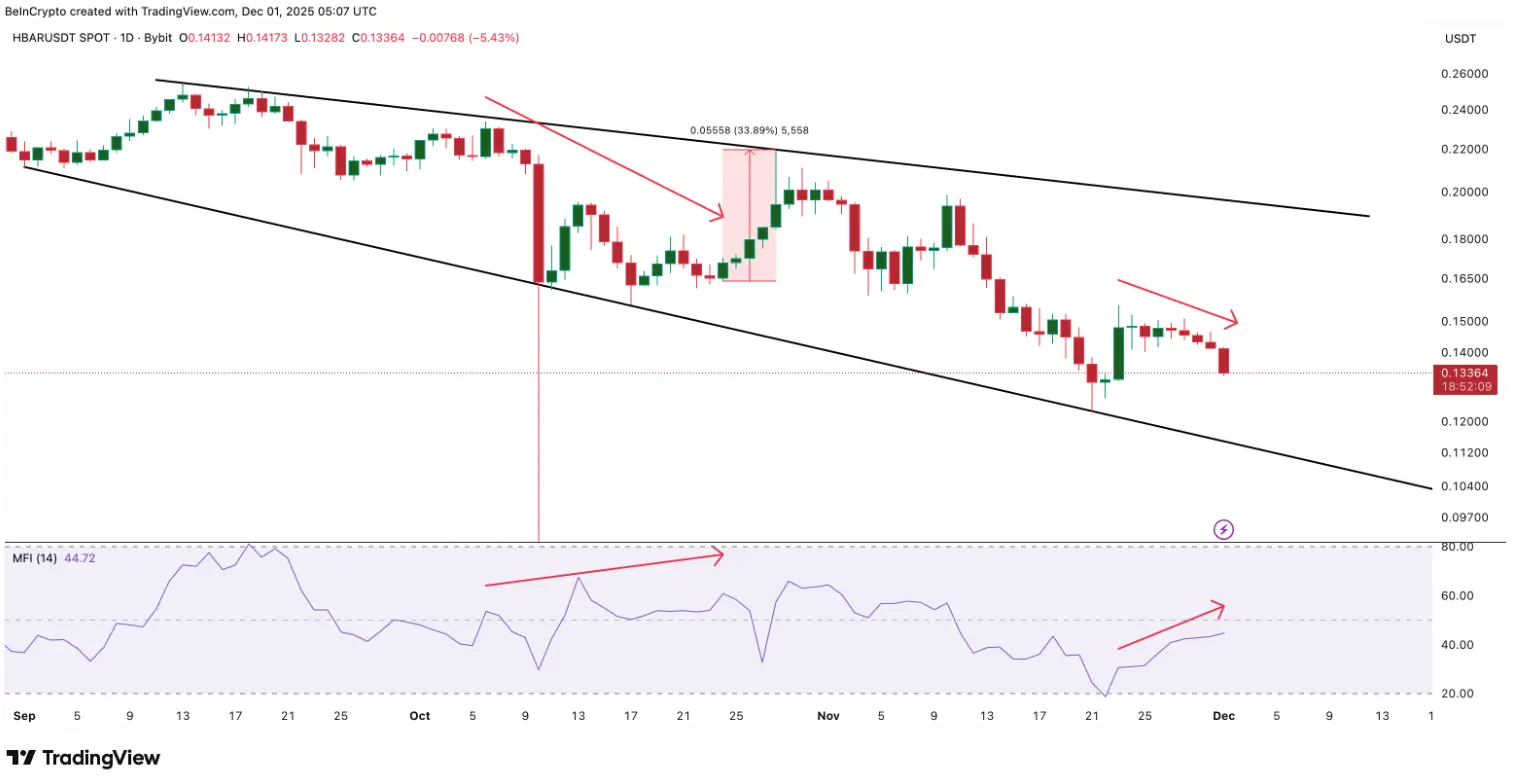
 Daily HBAR/USDT Chart | Source: TradingViewThe second clue comes from the MFI (Money Flow Index), which tracks buying and selling pressure based on both price and volume. During the period from 23/11 to 1/12, the price of HBAR continuously created lower highs, while the MFI formed higher highs. This divergence indicates that the downtrends are being absorbed by stealth buying. Previously, a similar divergence occurred from 6/10 to 24/10 which led to a 33% increase when completed.
 Daily HBAR/USDT Chart | Source: TradingViewThe third clue comes from the stable demand for spot ETFs. The Canary HBAR ETF Spot has seen positive weekly inflows in four out of the last five weeks, with total inflows exceeding 80 million USD. Although this inflow is lower than at the end of October, it remains positive even as prices fall, indicating that underlying demand remains strong.
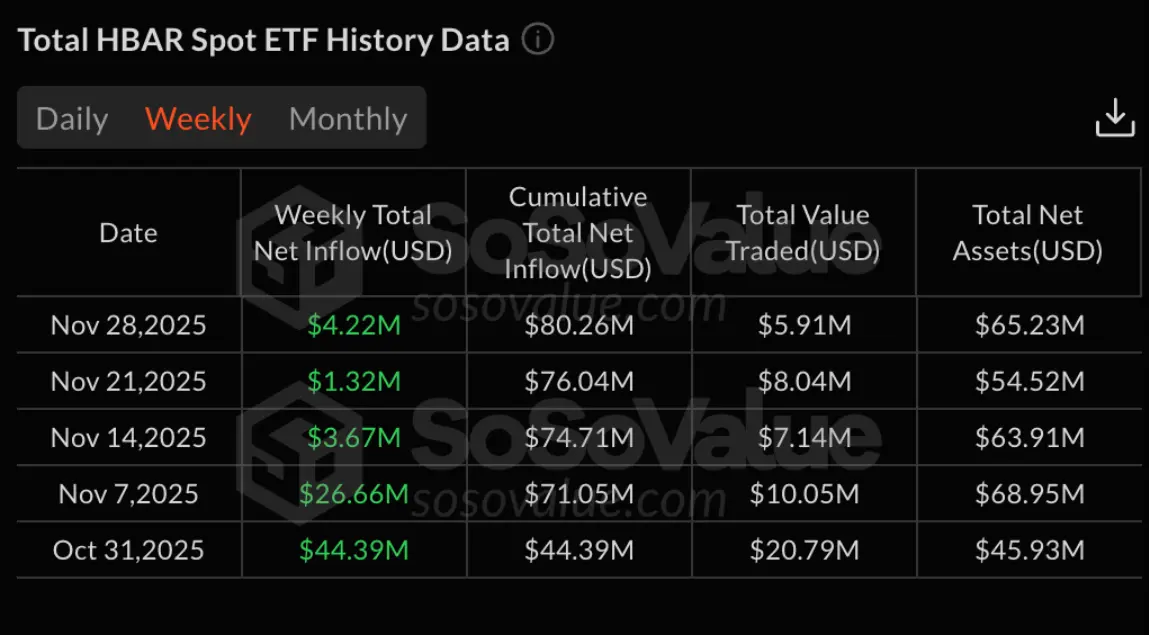 ETF flow of HBAR | Source: SoSo ValueCombining all three clues — the shift in control of volume, buying pressure during falls, and continuous ETF inflows — indicates that HBAR is entering an early accumulation phase, quietly forming beneath the surface of the crypto market.
Important price levels determine whether the recovery momentum is sustainable
The most important support level currently for HBAR is near the lower line of the wedge pattern, around $0.122. If the price holds this area, the recovery scenario still has a chance. Conversely, a break below $0.122 will pave the way for the next support area around $0.079, while turning the market structure from “early accumulation” into a deeper decline.
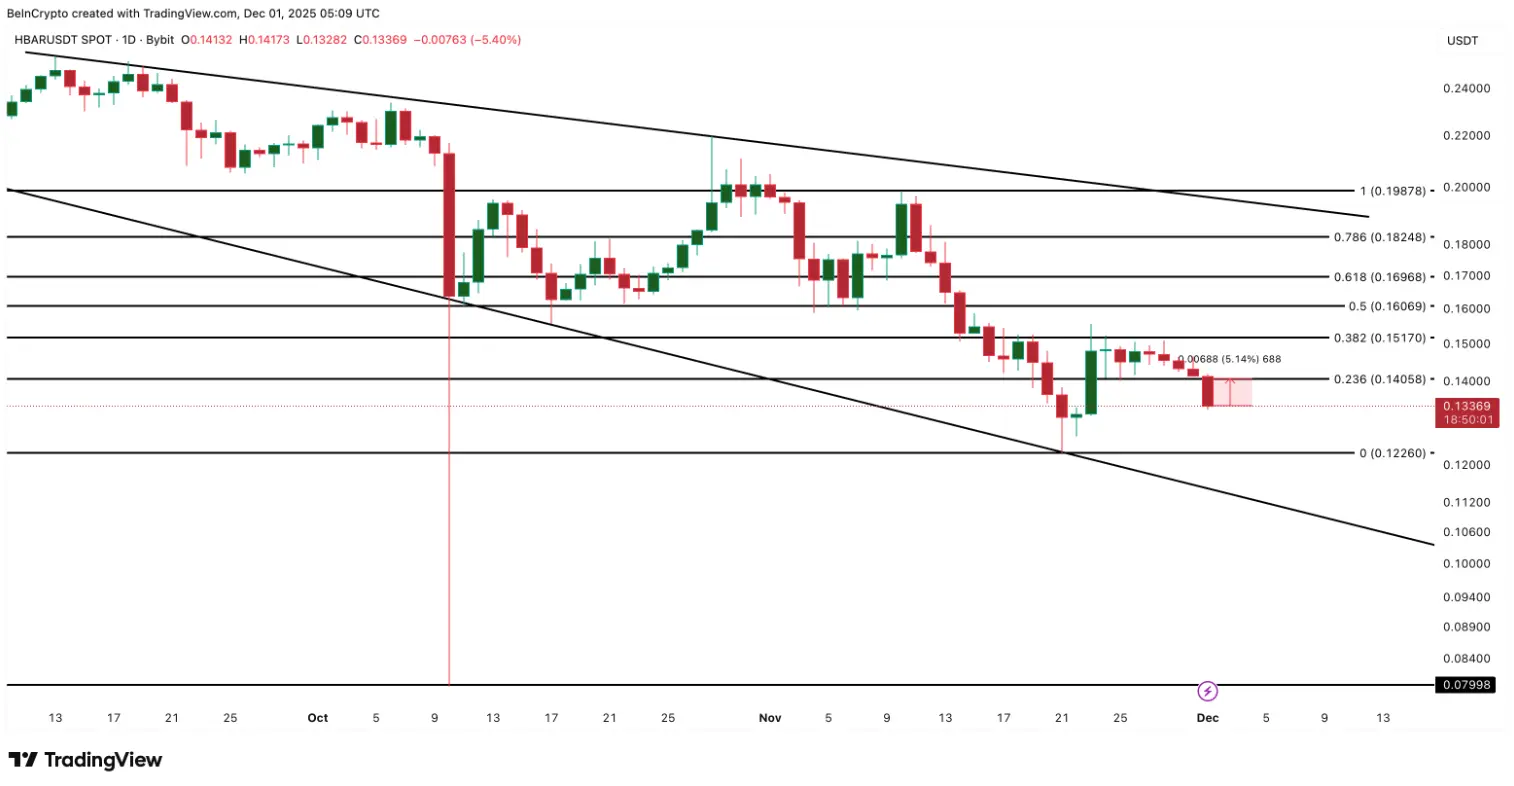 Daily HBAR/USDT Chart | Source: TradingViewTo prove its strength, HBAR first needs to conquer the $0.140 level — equivalent to a recovery of about 5% from the current price. This will signal that buyers are gradually gaining an advantage over the pressure from the bears. If it surpasses $0.140, the next target is $0.155. Further progress above $0.155 will open the door towards $0.169, and even $0.182, in case the crypto market shows signs of improvement.
SN_Nour
Disclaimer: The information on this page may come from third parties and does not represent the views or opinions of Gate. The content displayed on this page is for reference only and does not constitute any financial, investment, or legal advice. Gate does not guarantee the accuracy or completeness of the information and shall not be liable for any losses arising from the use of this information. Virtual asset investments carry high risks and are subject to significant price volatility. You may lose all of your invested principal. Please fully understand the relevant risks and make prudent decisions based on your own financial situation and risk tolerance. For details, please refer to
Disclaimer.
Related Articles
Bitmine gets promoted to the NYSE main board! Tom Lee: US stocks may have bottomed out, and sell pressure on Ether could ease
Bitmine has officially moved from the NYSE American board to the main board, marking an important milestone for the company. Despite the sharp decline in its share price, it has still increased the share repurchase plan amount to $4 billion. The company holds a large amount of Ethereum, and it expects that a rebound in the crypto market will help boost its assets and share price performance.
CryptoCity1h ago
Why Is Bitcoin Up Today? Hormuz Blockade Triggers Short Squeeze and a BTC Test of $75k
On April 13, Bitcoin rose from its early-session low of 70,741 to trade as high as $74,900 during the session, approaching the $75,000 level. The main drivers came from two directions: after Trump ordered the blockade of the Strait of Hormuz, traders began to view Bitcoin as a geopolitical hedge asset; and a massive net short position that had been building as funding rates stayed persistently negative was met with liquidation, triggering a chain of liquidations totaling millions of dollars near the $70,000 support level.
MarketWhisper3h ago
Bitmine gets promoted to the NYSE main board! Tom Lee: U.S. stocks may have bottomed out, and Ether’s selling pressure may ease
Bitmine has officially moved from the NYSE American board to the main board in the United States, marking an important milestone for the company. Despite a sharp drop in its stock price, it has still increased its share repurchase authorization to $4.0 billion. The company holds a large amount of Ether, and it predicts that a rebound in the crypto market will help boost its assets and stock price performance.
CryptoCity5h ago
U.S. stocks have recovered the losses since the Iran war, while Bitcoin pushes up to 74K
Due to market expectations that the United States and Iran will reach an agreement, the S&P 500 index has rebounded to its highest level since the war, and Bitcoin has also surged to $74,900. Despite the failure of peace talks between the U.S. and Iran, the U.S. has imposed a maritime blockade to pressure Iran. MicroStrategy once again made a large-scale purchase of Bitcoin, indicating that investor confidence is picking up.
ChainNewsAbmedia5h ago
BTC 15-minute surge up 0.77%: Spot buy-side demand and on-chain activity convergence drive short-term strength
2026-04-13 22:00 to 2026-04-13 22:15 (UTC), the BTC price fluctuated upward within 15 minutes, with a return of +0.77%. The high and low prices in the range were between 73178.0 and 73899.0 USDT, and the amplitude was 0.99%. During the event, market attention increased, volatility slightly intensified, and overall sentiment leaned positive.
The main driver behind this price deviation was active spot market buy orders stepping in, which pushed the BTC price higher in the short term. The number of active addresses on-chain remained at a high level, reflecting an increase in genuine trading demand. Trading volume was higher than in the previous period,
GateNews6h ago
