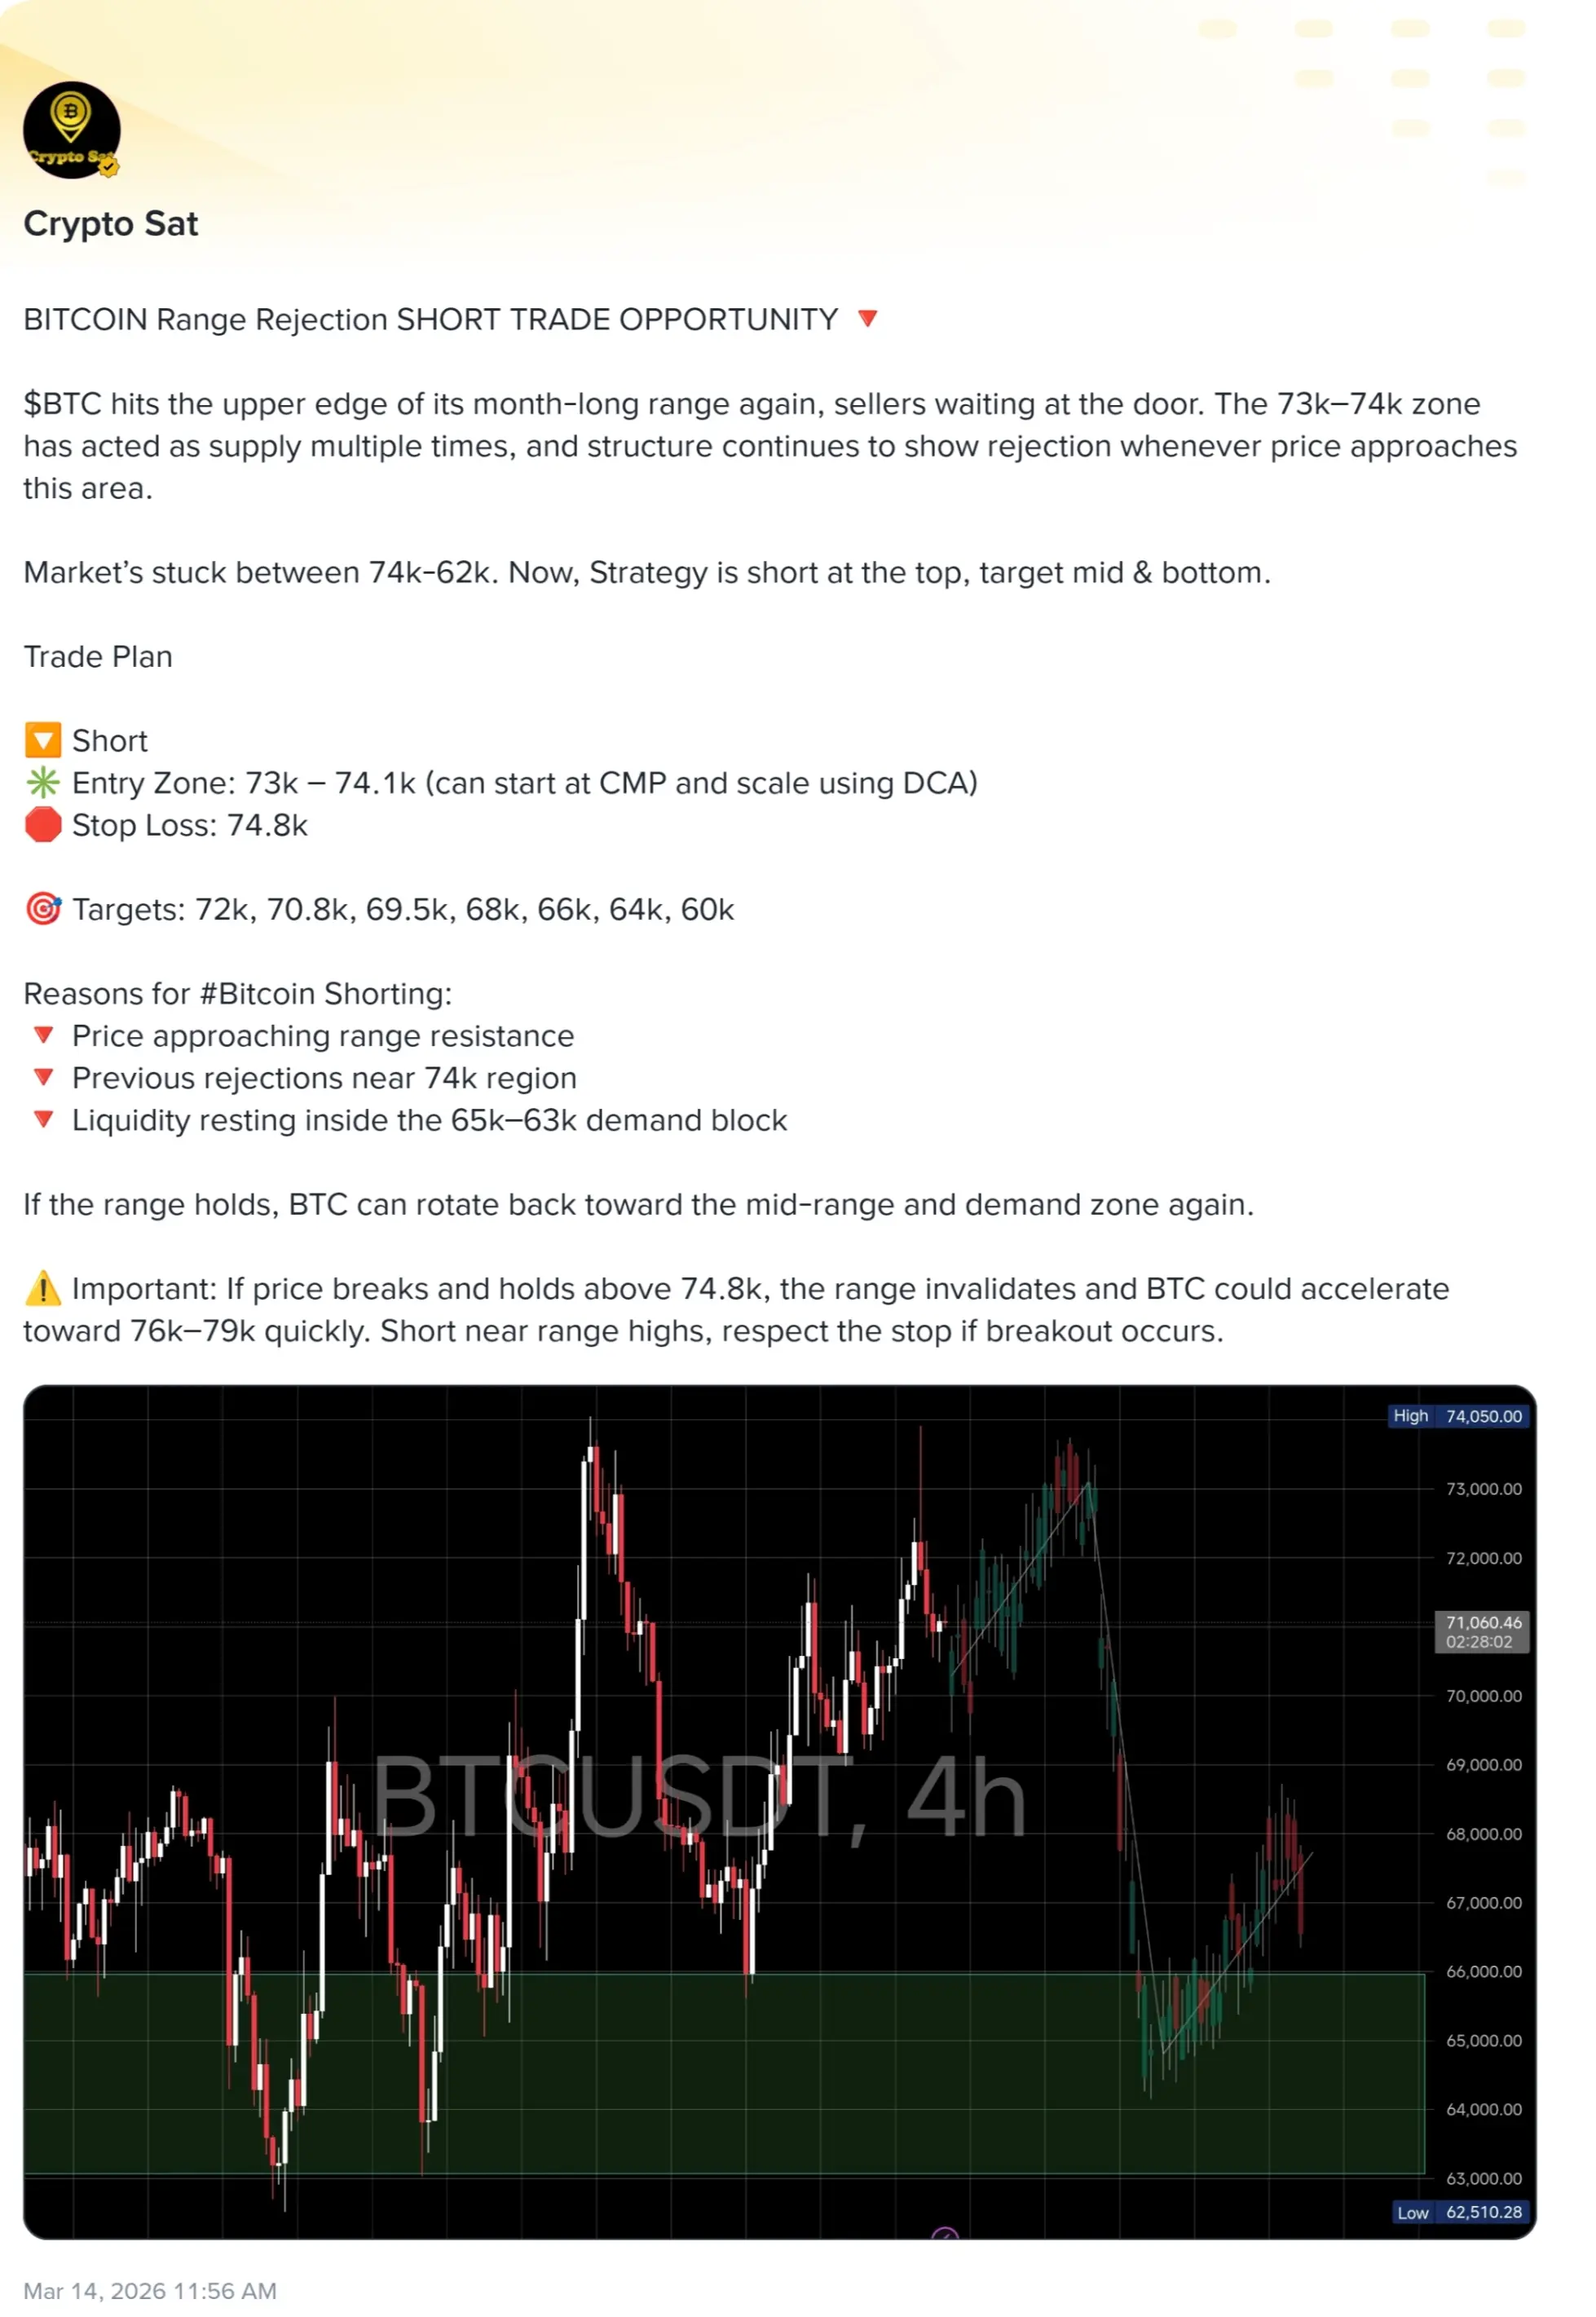
BITCOIN Range Rejection SHORT TRADE OPPORTUNITY 🔻
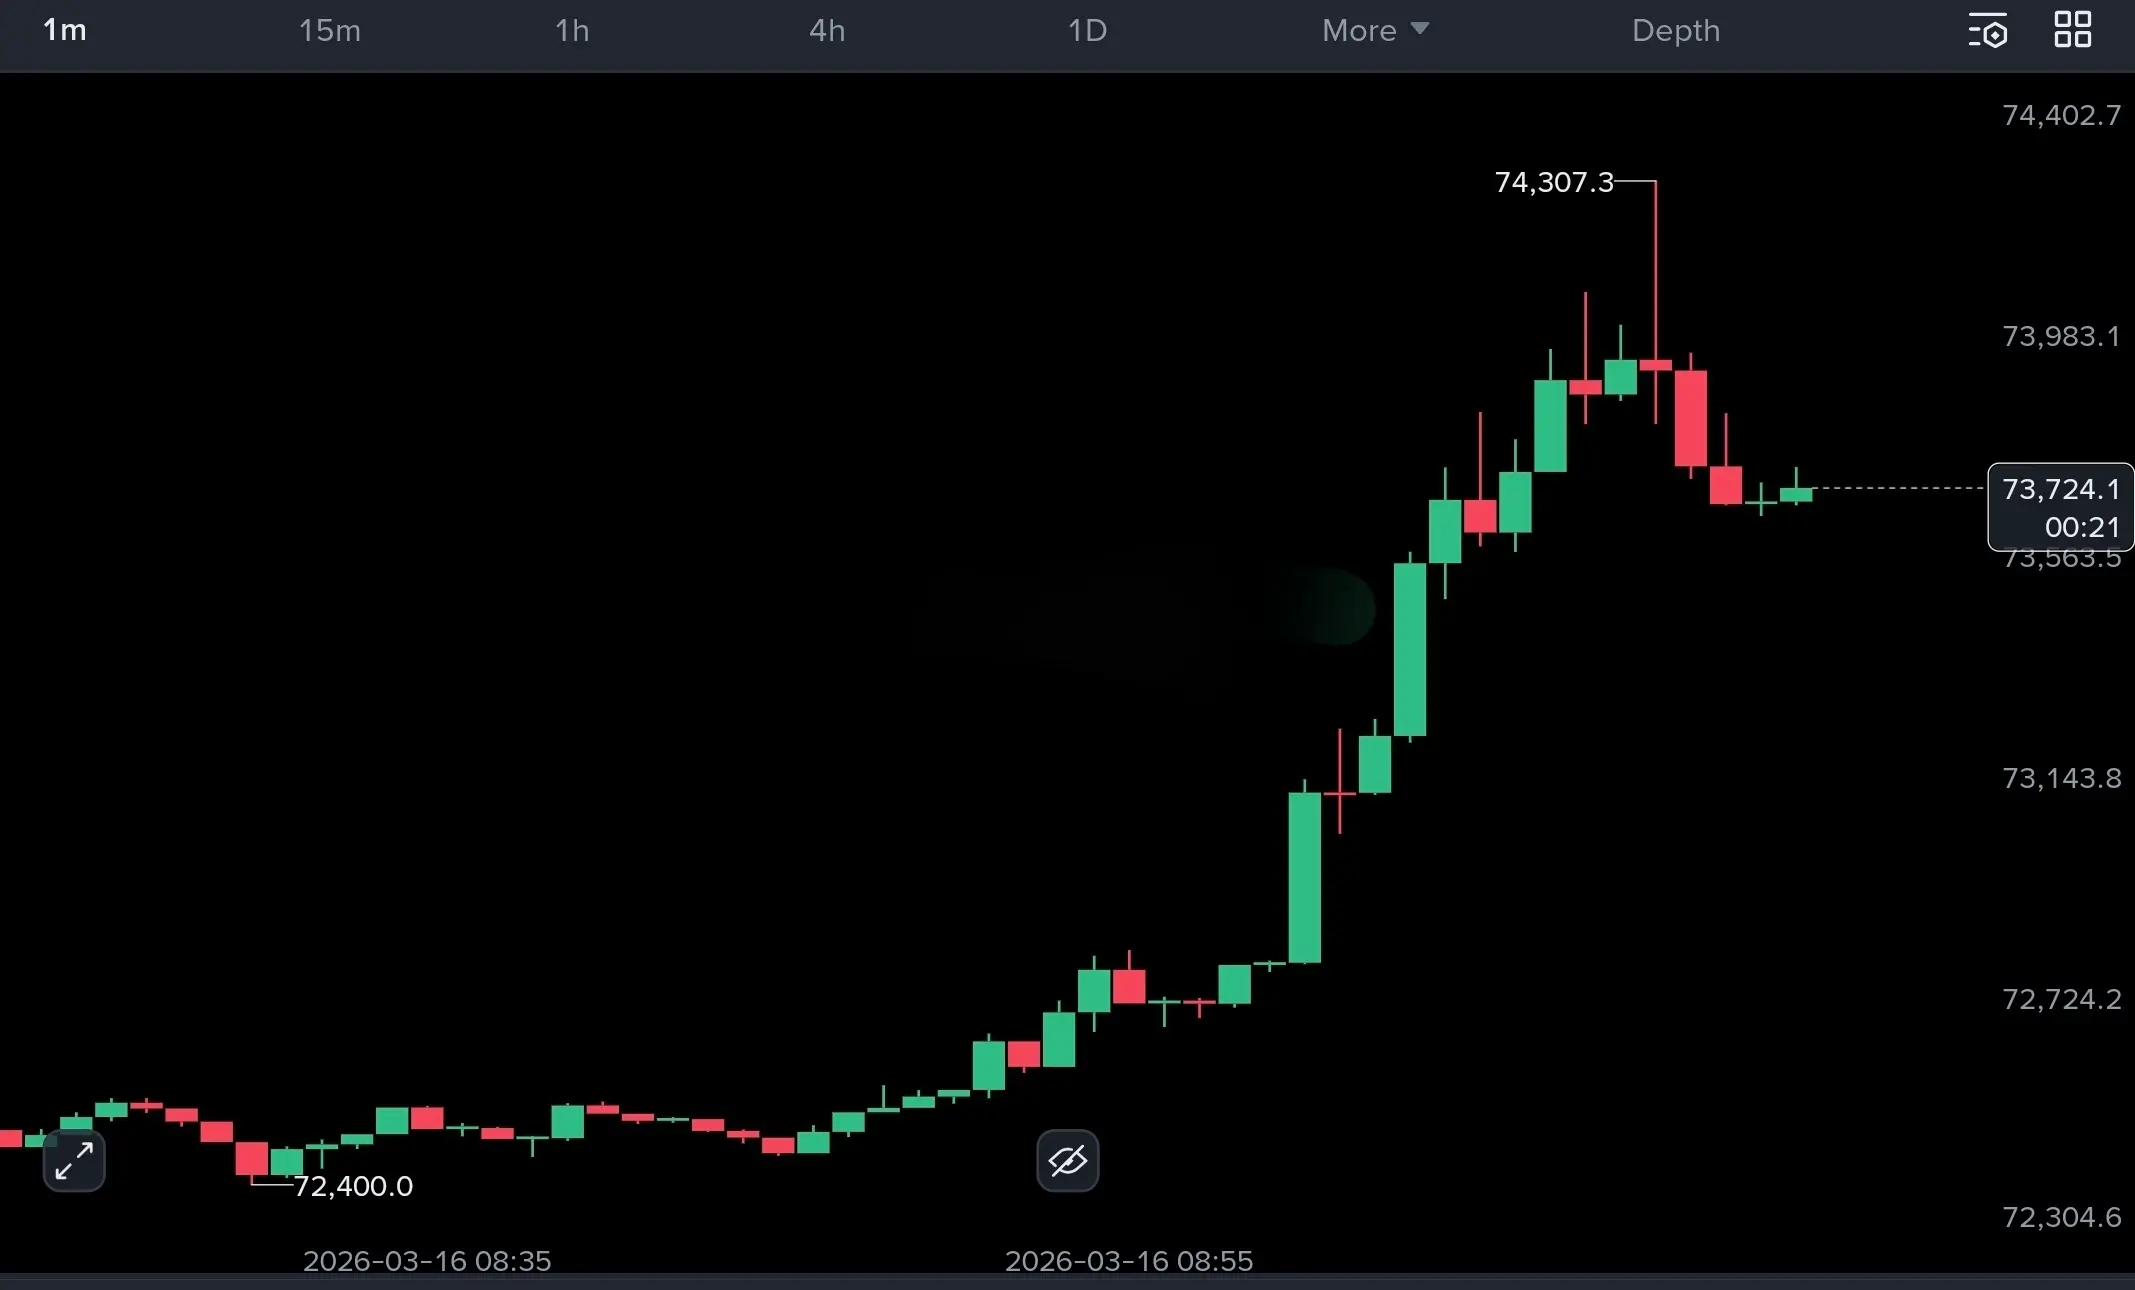
$BTC hits the upper edge of its month-long range again, sellers waiting at the door. The 73k–74k zone has acted as supply multiple times, and structure continues to show rejection whenever price approaches this area.
Market’s stuck between 74k-62k. Now, Strategy is short at the top, target mid & bottom.
Trade Plan
🔽 Short
✳️ Entry Zone: 73k – 74.1k (can start at CMP and scale using DCA)
🛑 Stop Loss: 74.8k
🎯 Targets: 72k, 70.8k, 69.5k, 68k, 66k, 64k, 60k
Reasons for #Bitcoin Shorting:
🔻 Price approaching range resistance
🔻 Previous rejections near 74k region
🔻 Liquidity resting inside the 65k–63k demand block
If the range holds, BTC can rotate back toward the mid-range and demand zone again.
⚠️ Important: If price breaks and holds above 74.8k, the range invalidates and BTC could accelerate toward 76k–79k quickly. Short near range highs, respect the stop if breakout occurs.