


# Ethereum Weekly Price Forecast: Early Bullish Momentum Decline Amid Iranian War Impact on Markets
**Ethereum Price Today: $2,130**
The leading altcoin experienced increasing bullish momentum in the first half of the week, accompanied by institutional buying, whale accumulation, and expanded interest in financial derivatives.
BitMine Immersion (BMNR), a company specializing in Ethereum treasury management, announced on Monday that it purchased 60,999 Ethereum, raising its holdings to 4.59 million Ethereum.
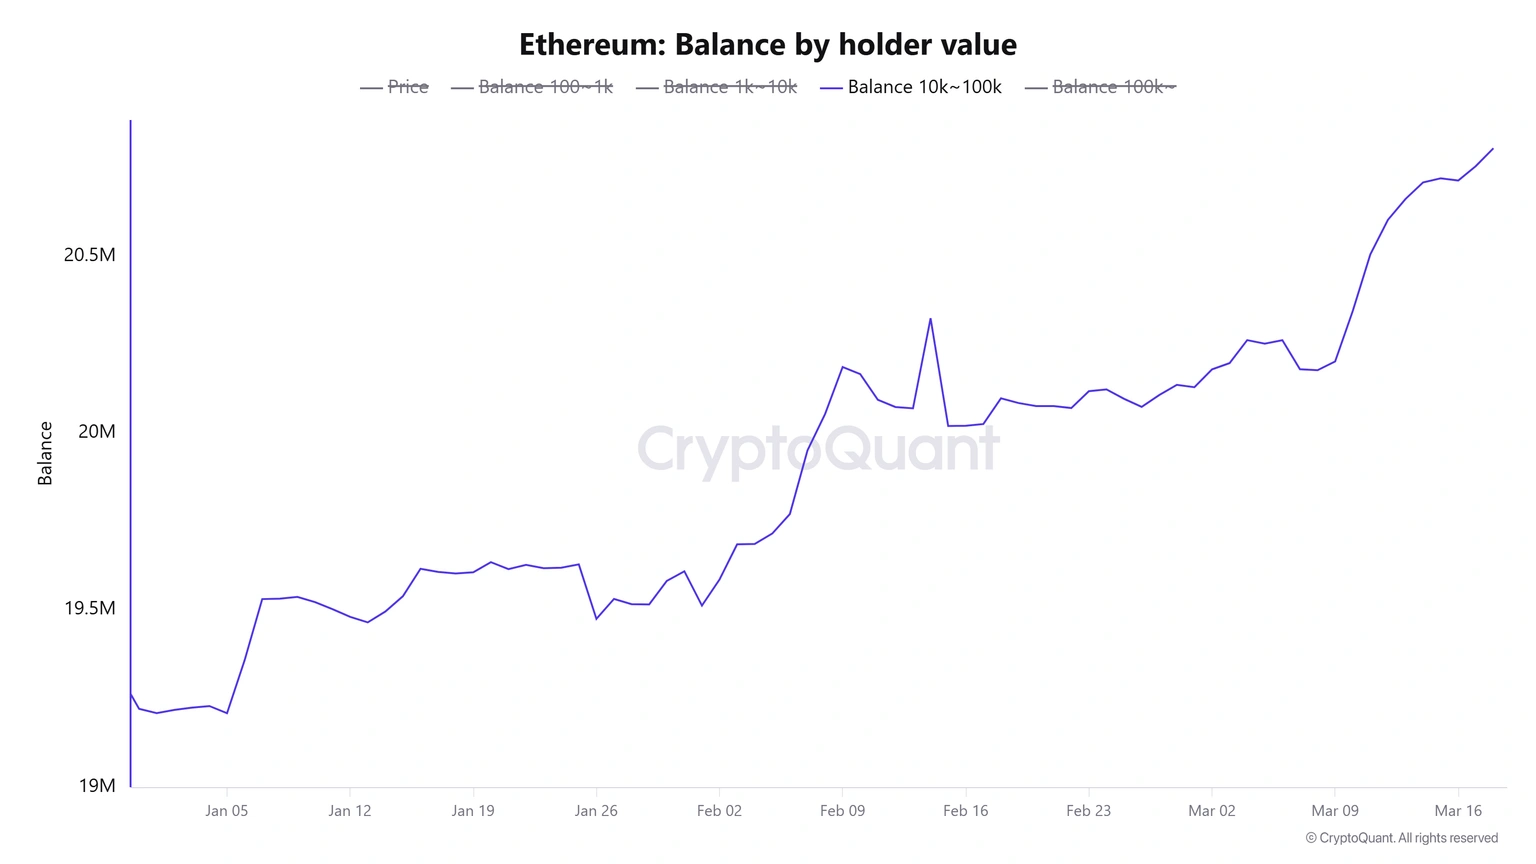
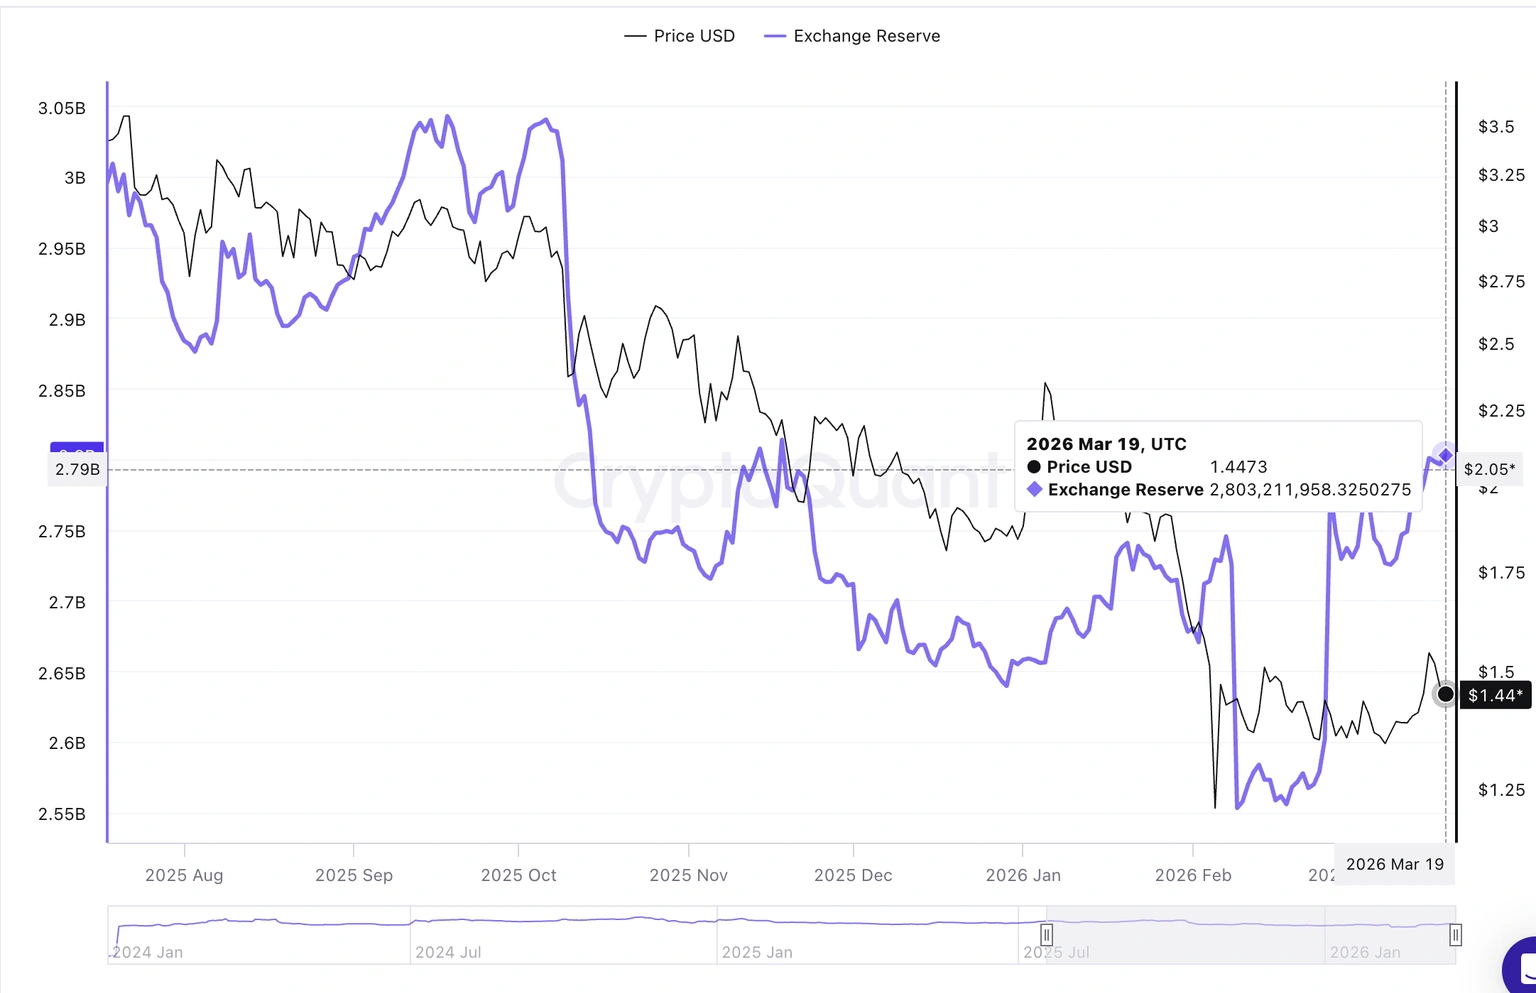
Whales (wallets holding between 10,000 and 100,000 Ethereum) also demonstrated strong accumulation, while retail traders continued to show weakness in trading activity.
**Ethereum balance by holder value. Source: Crypto Quant**
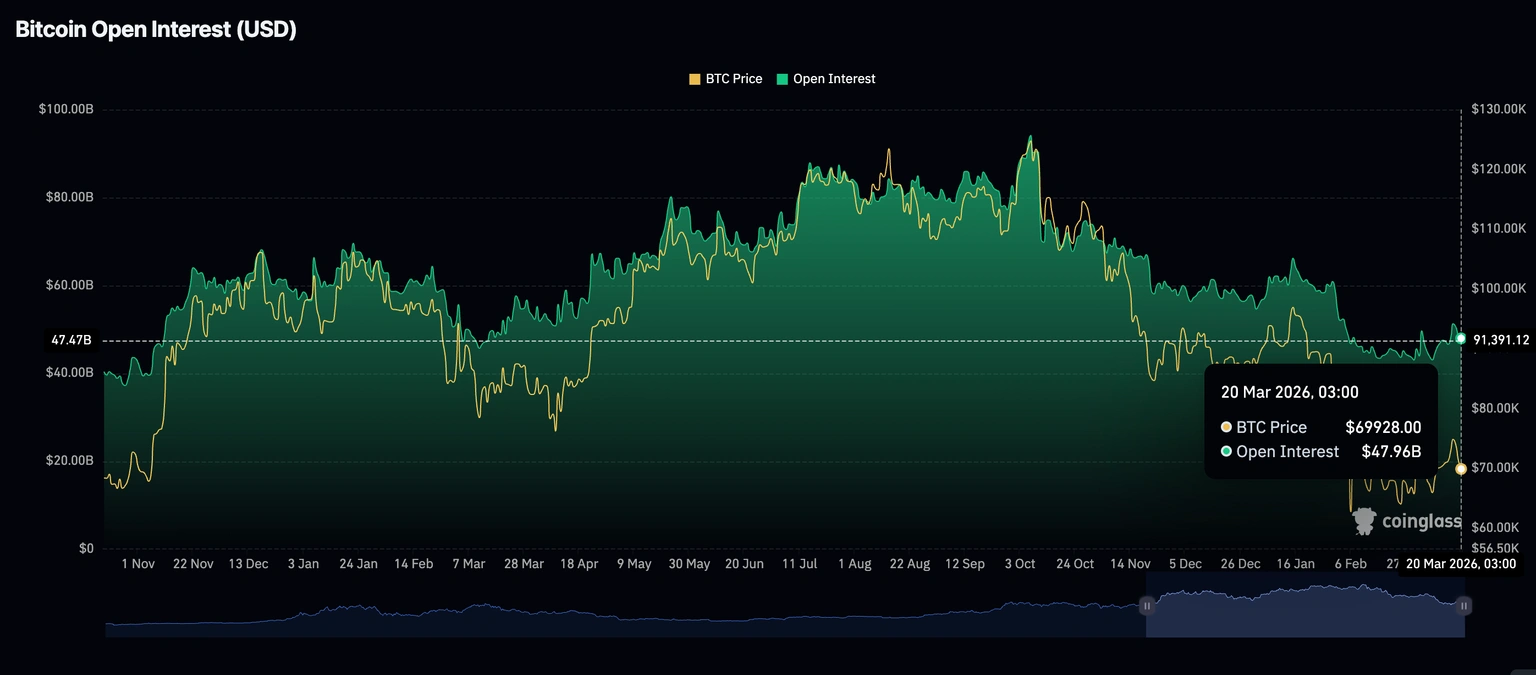
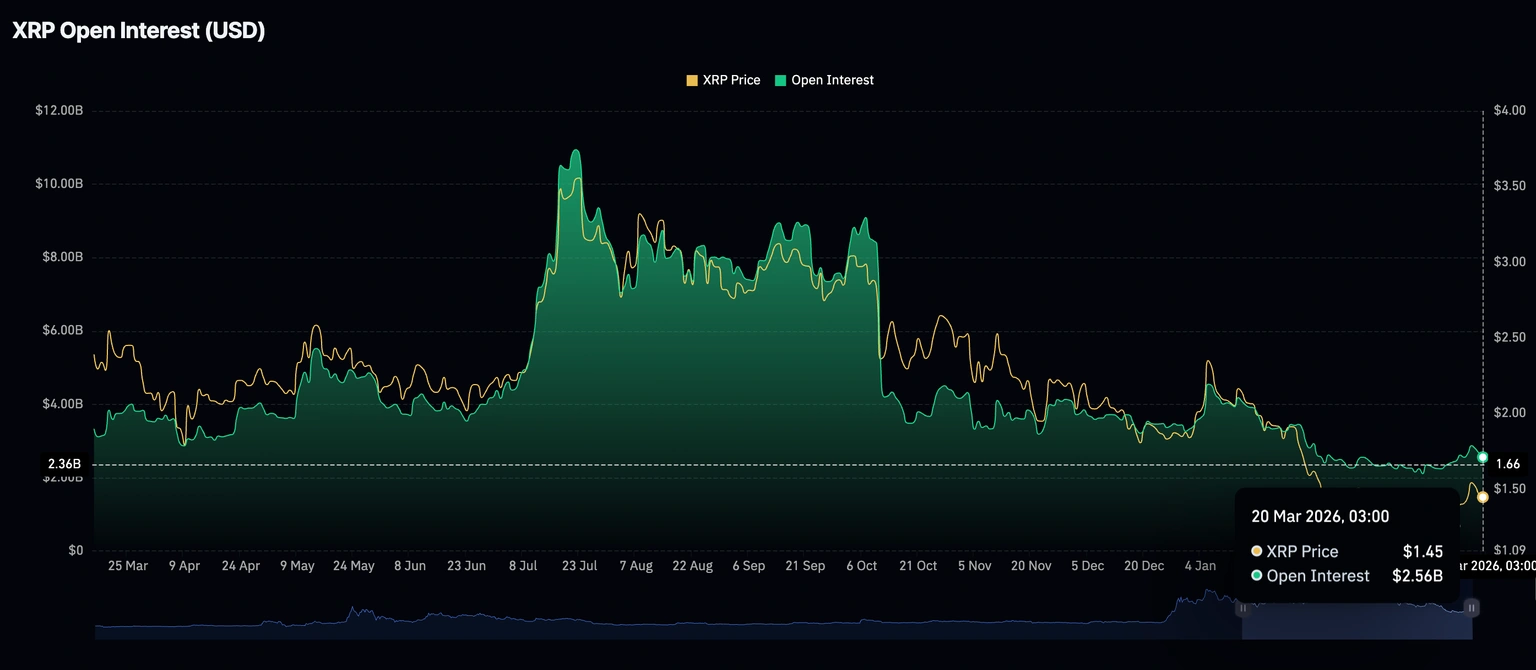
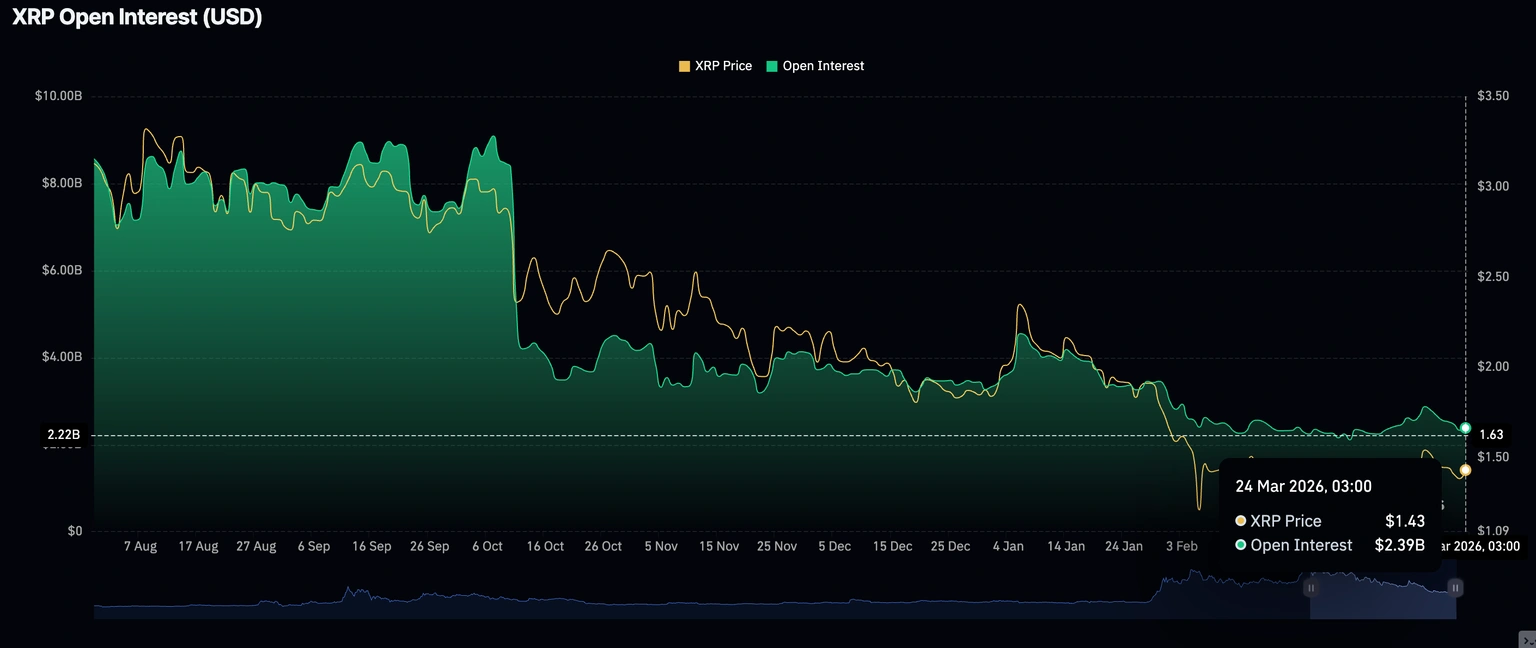
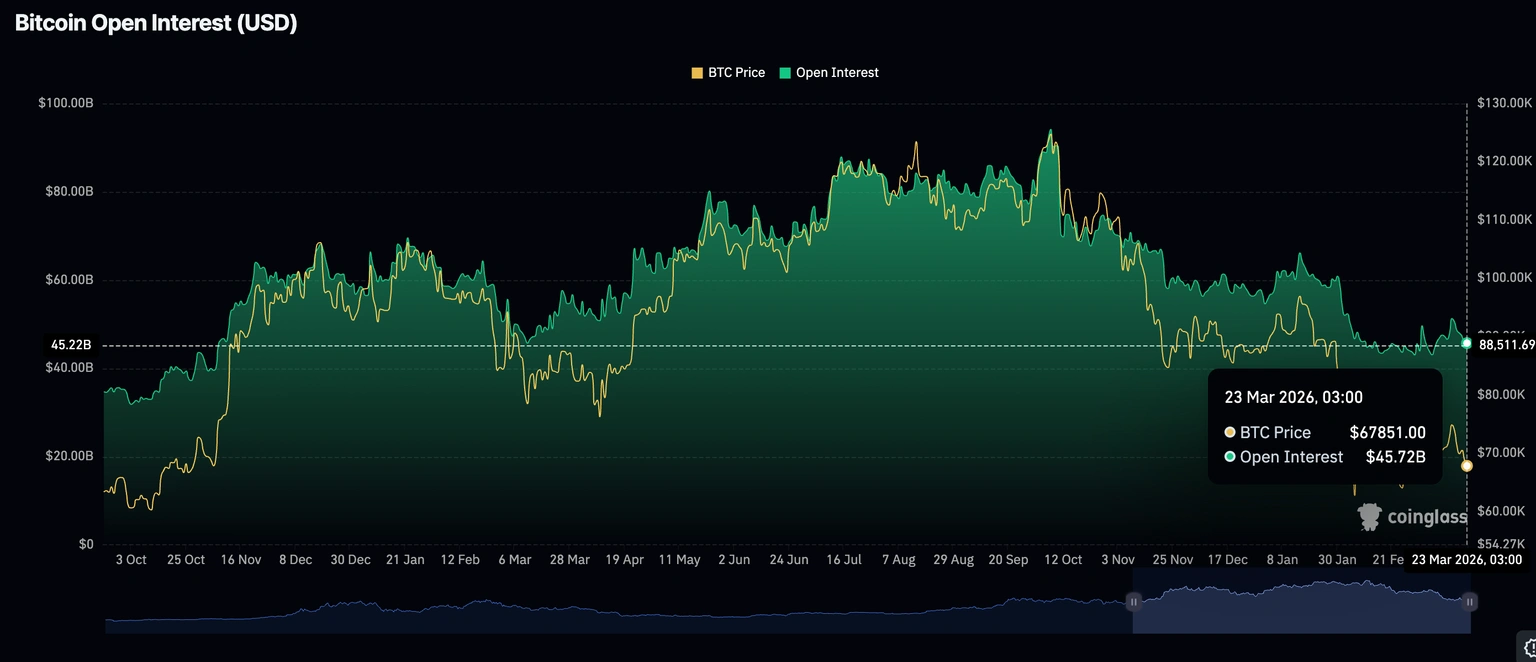
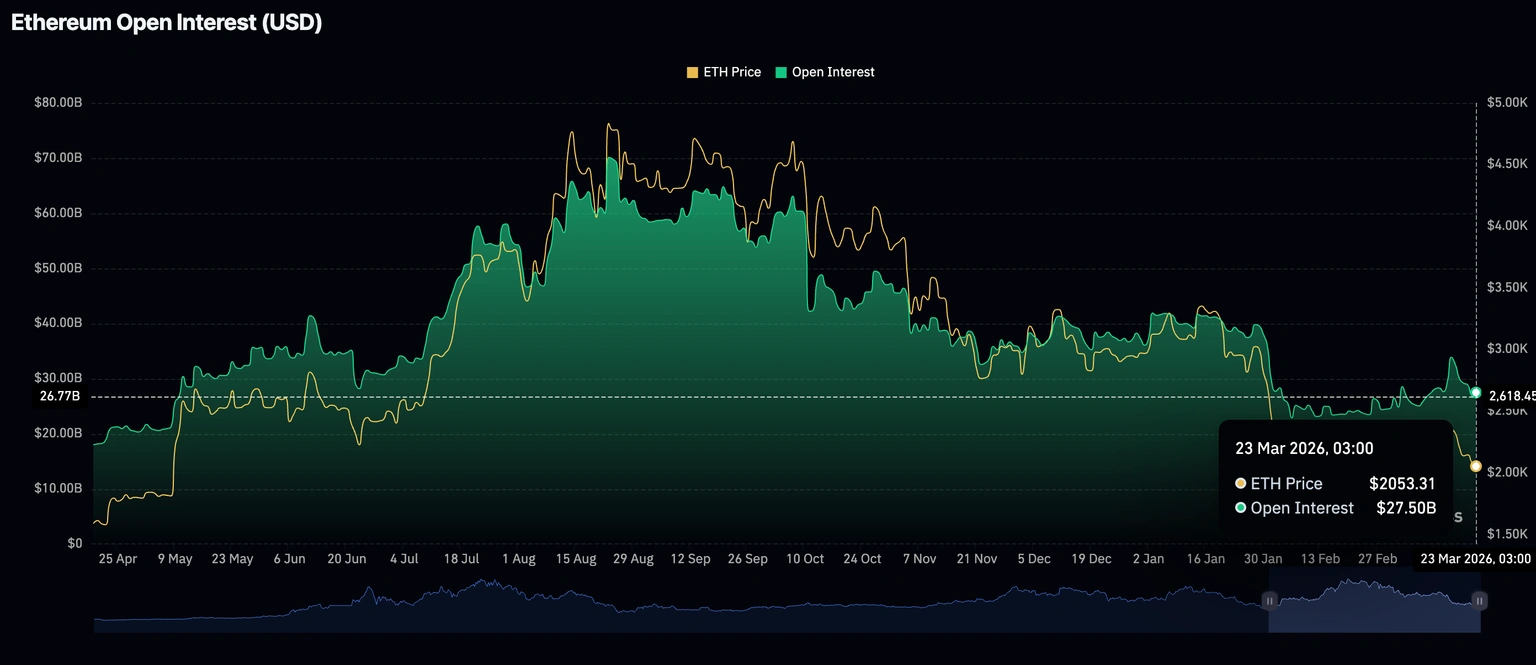
Notably, the Ethereum derivatives market saw renewed interest from long-term traders after open interest rose to its highest level since last September, while positive net flows continued among traders using market orders.
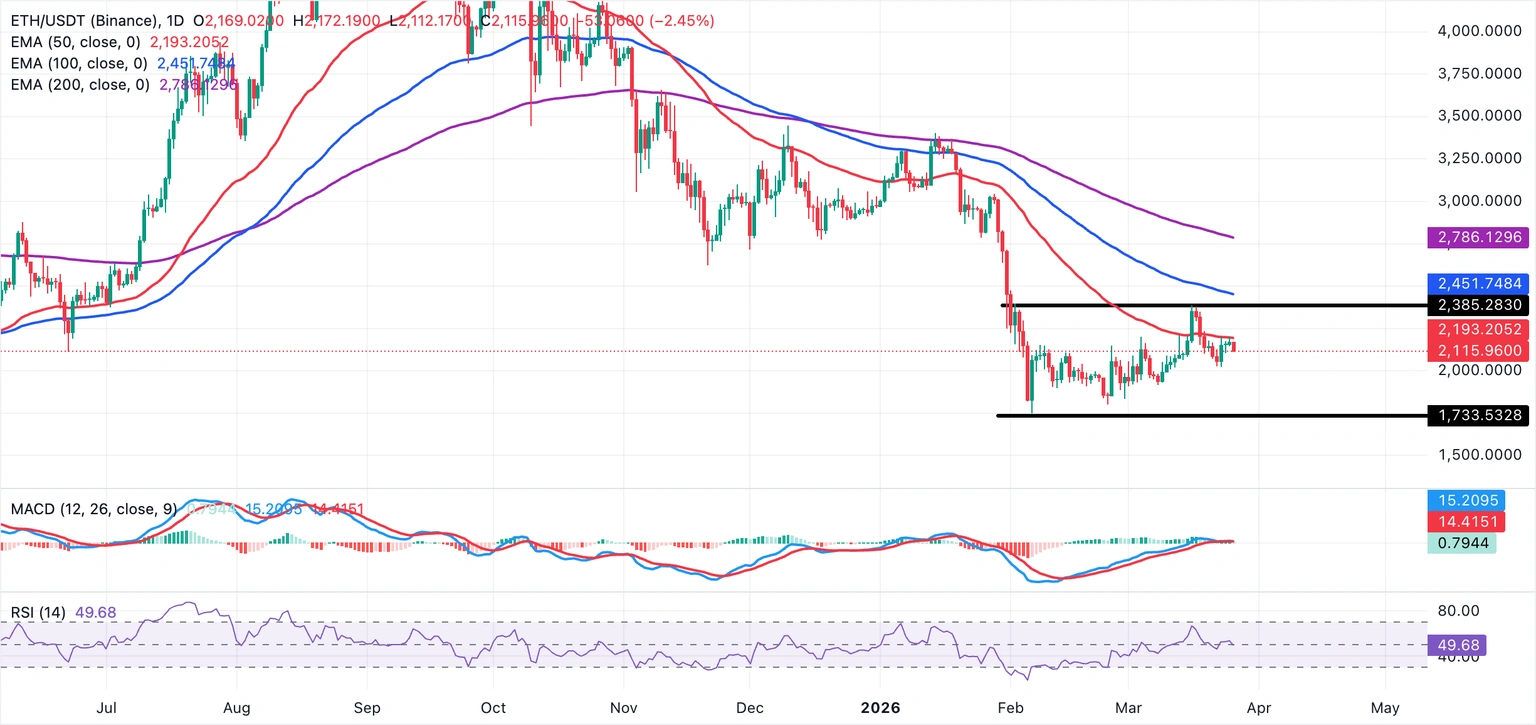
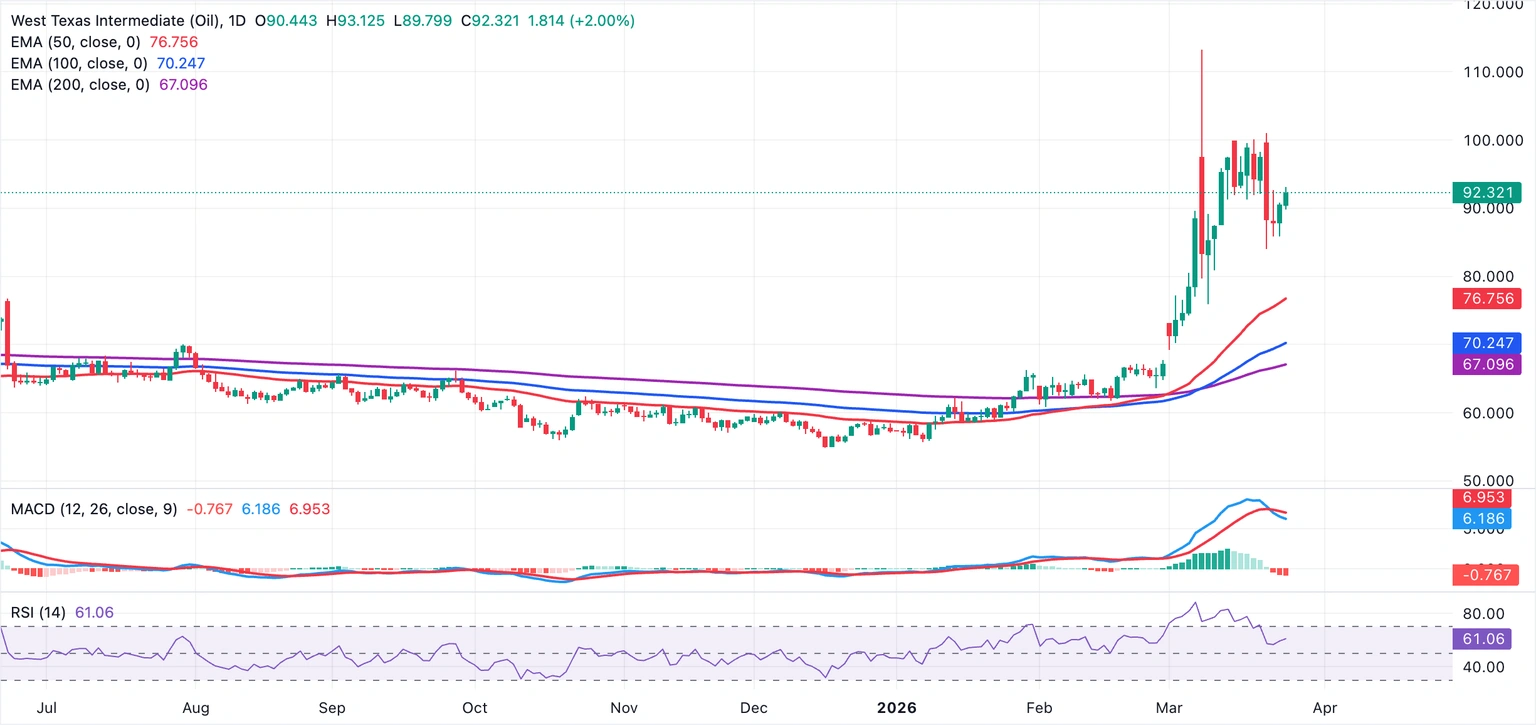
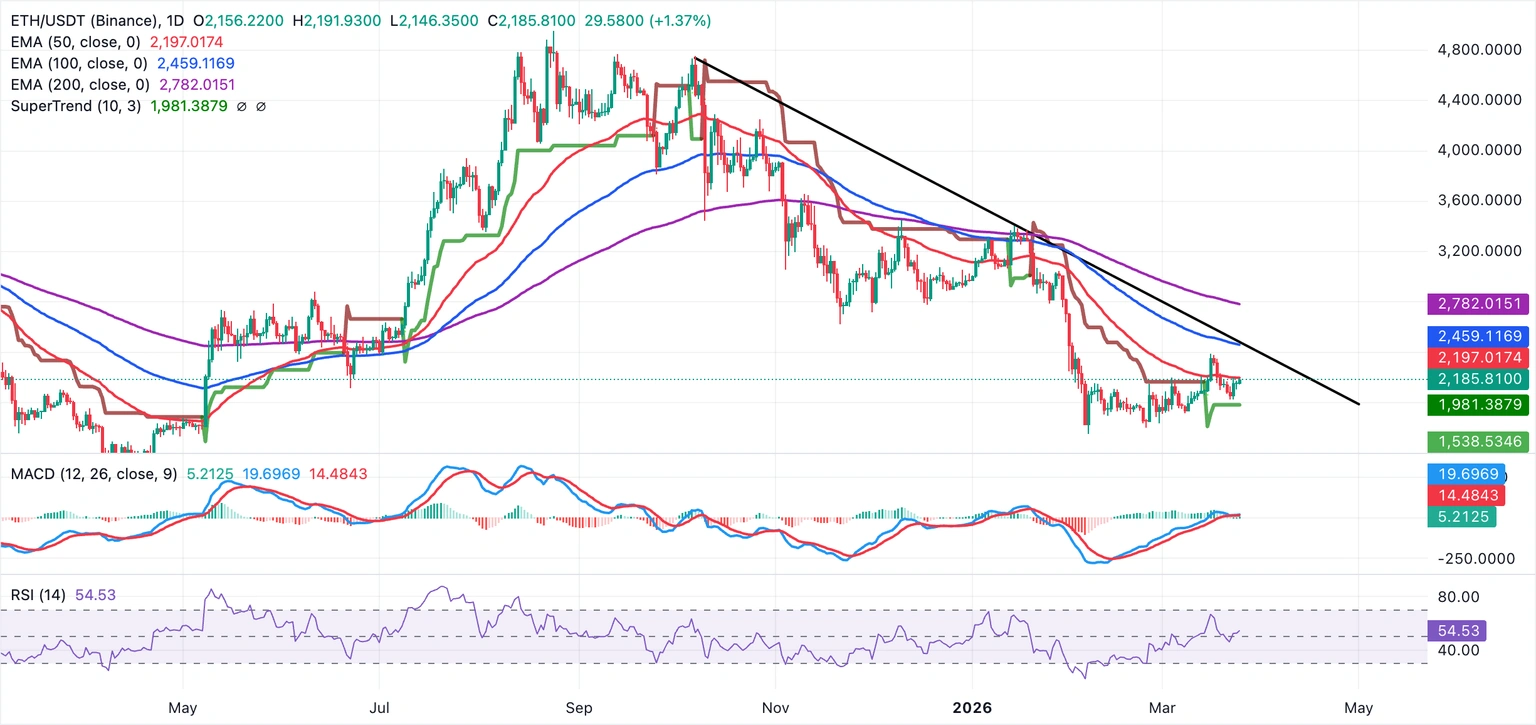
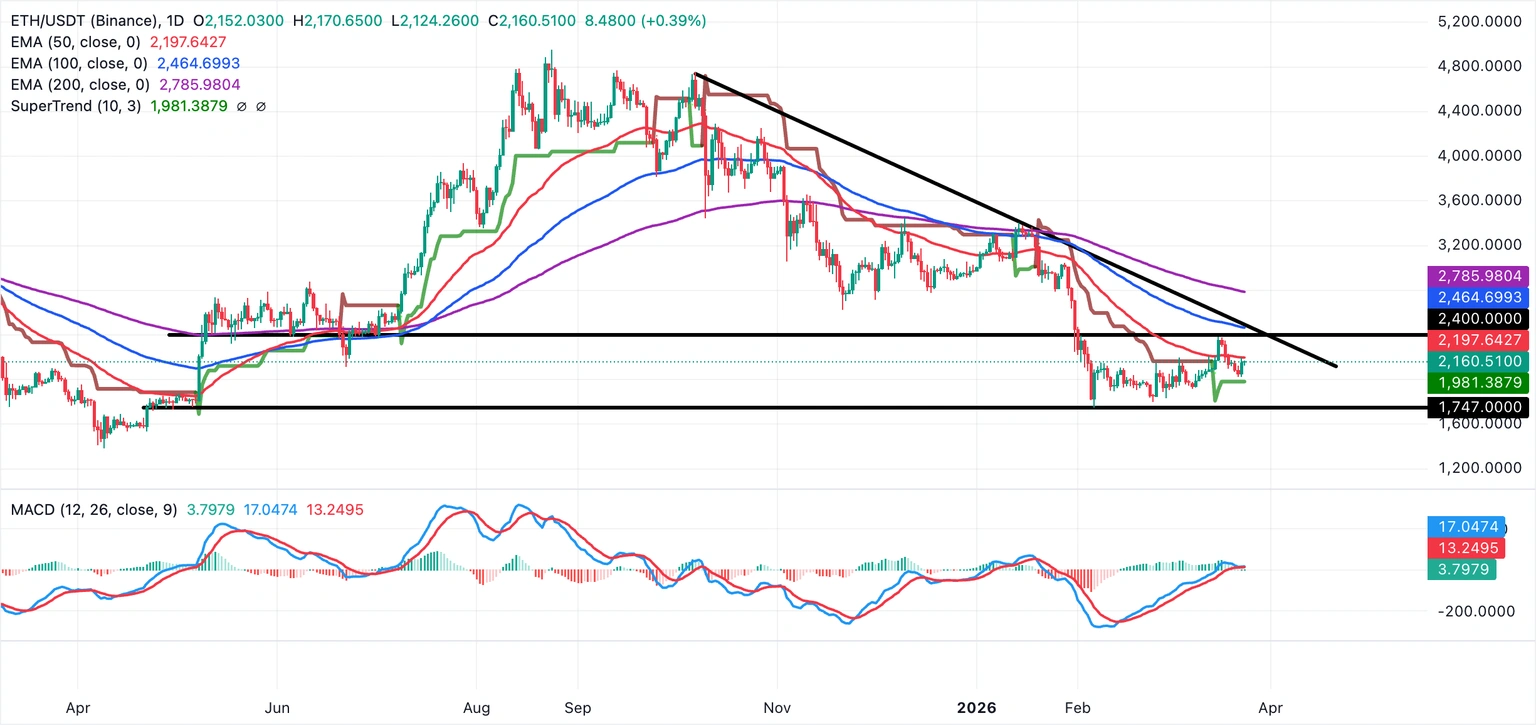
However, oil price volatility and diminishing expectations for interest rate cuts in 2026, driven by Middle East tensions, ultimately impacted the leading altcoin.
As a result, Ethereum experienced a decline near its implied price level or the cost of purchase on the blockchain, around $2,310, indicating that investors preferred to wait after reaching break-even. Historically, this level has triggered distribution activities in case of weakening uptrends.
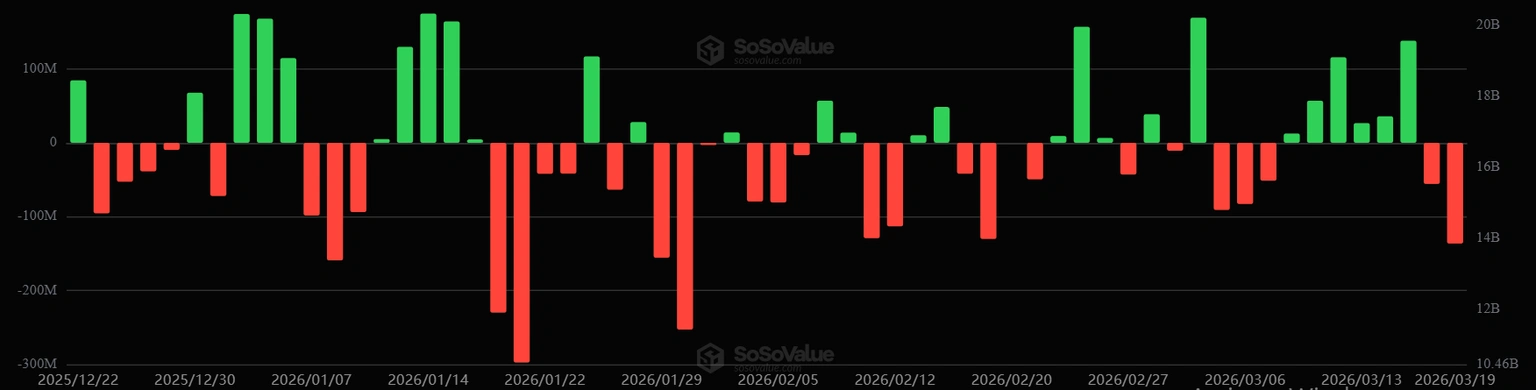
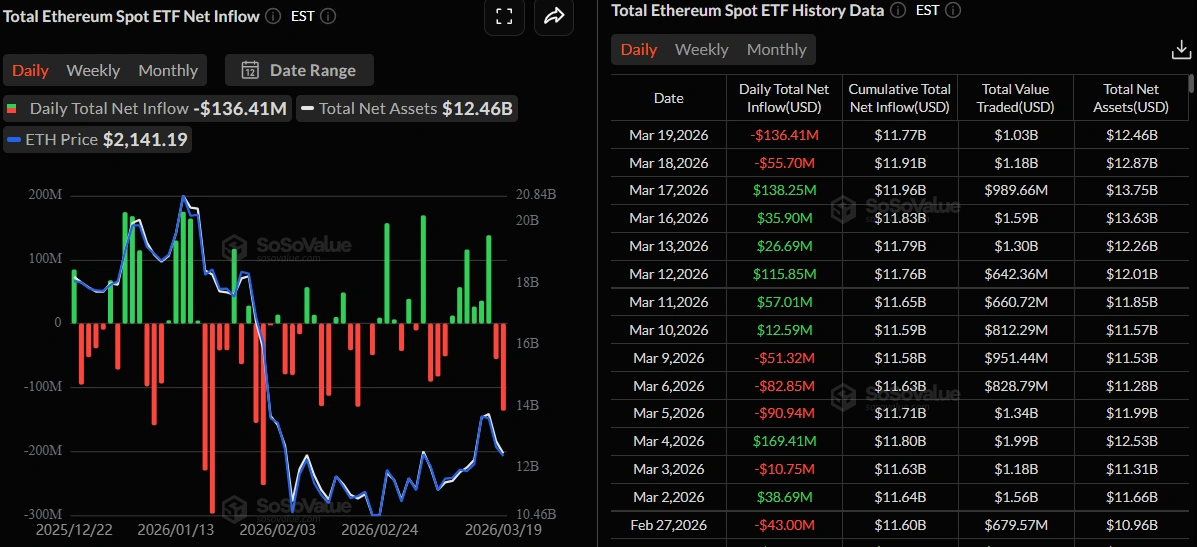
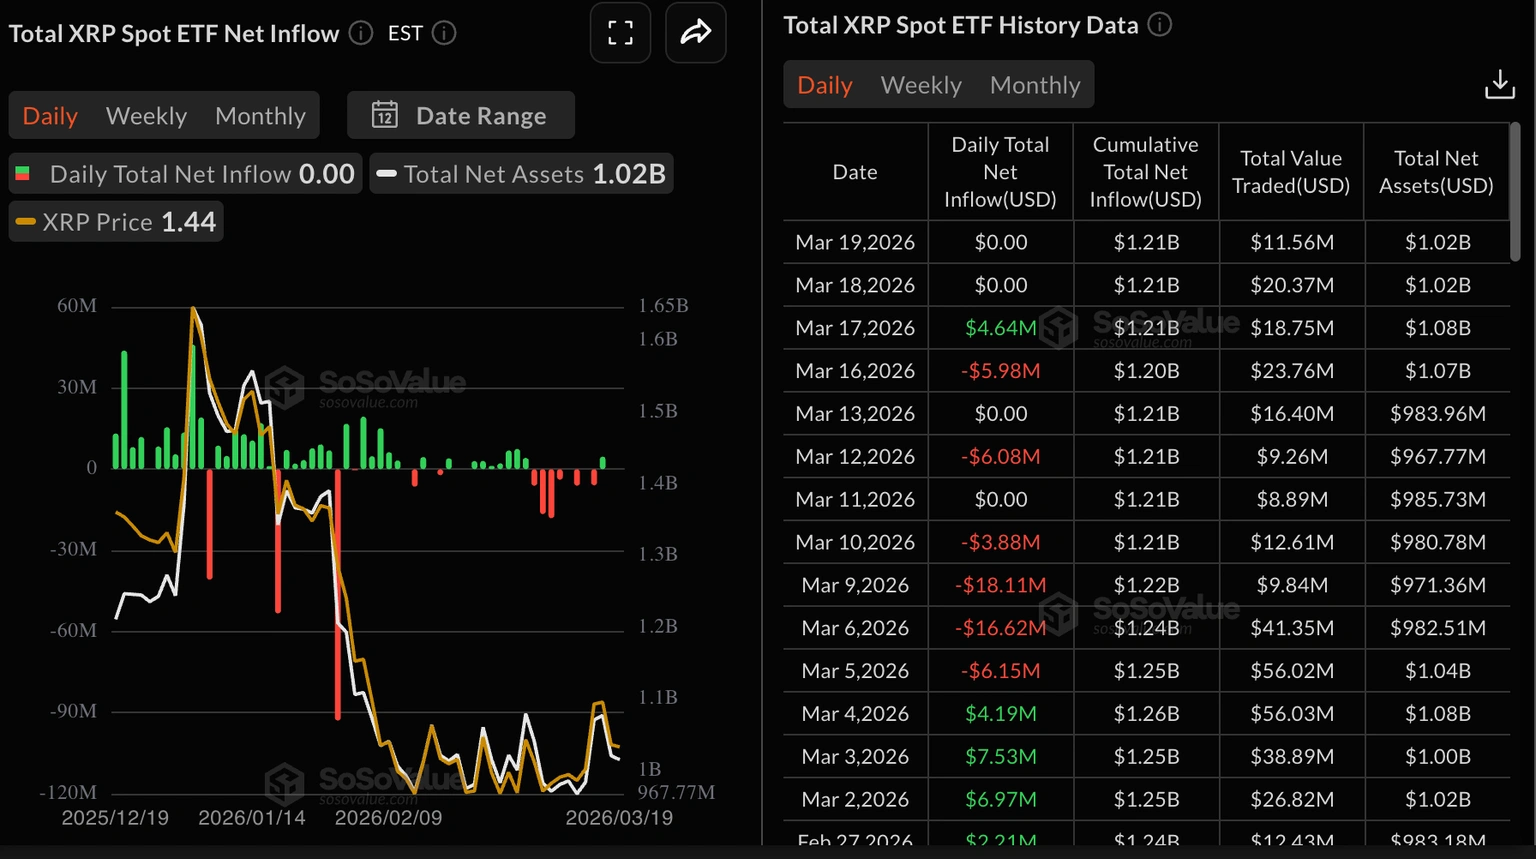
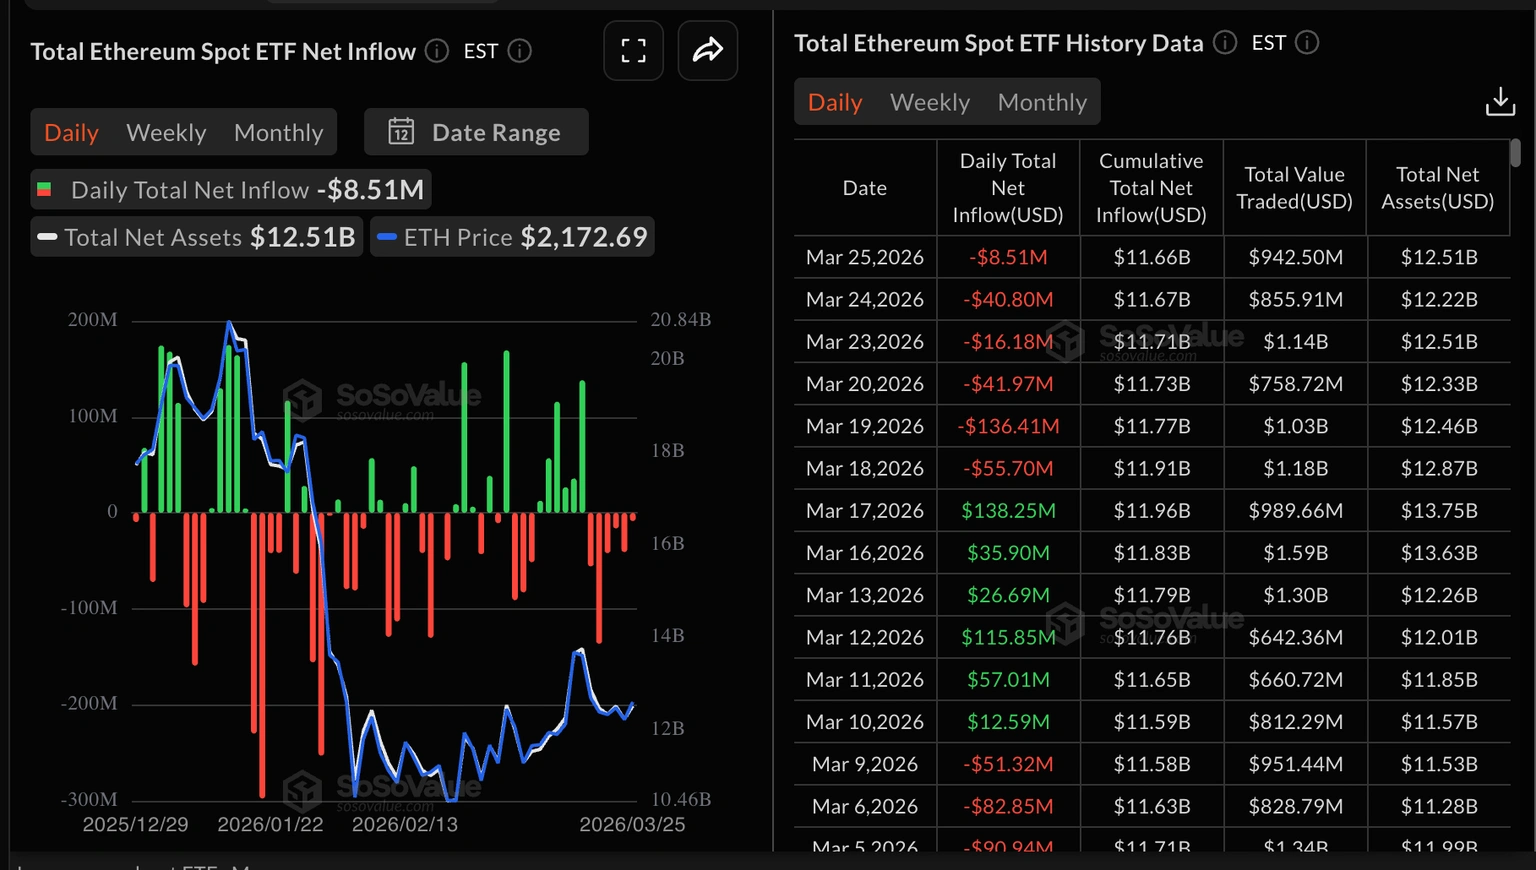
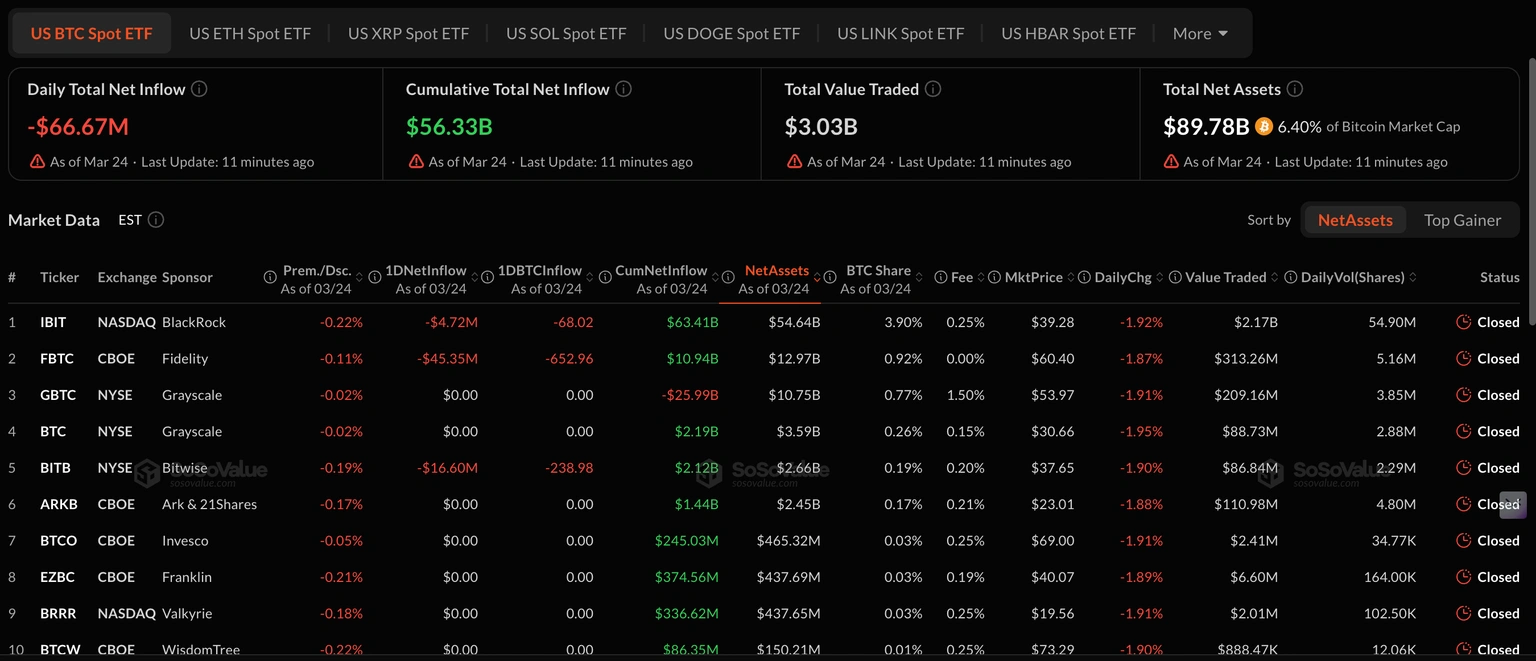
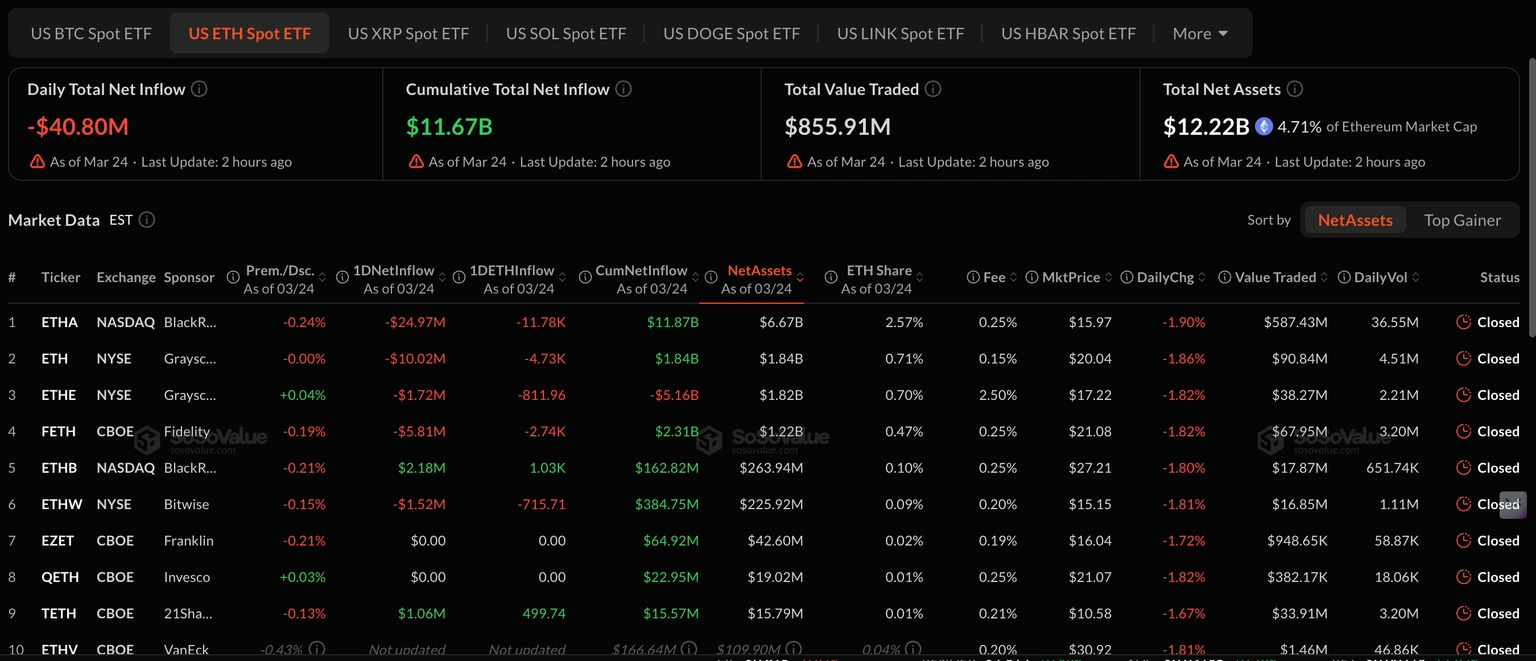
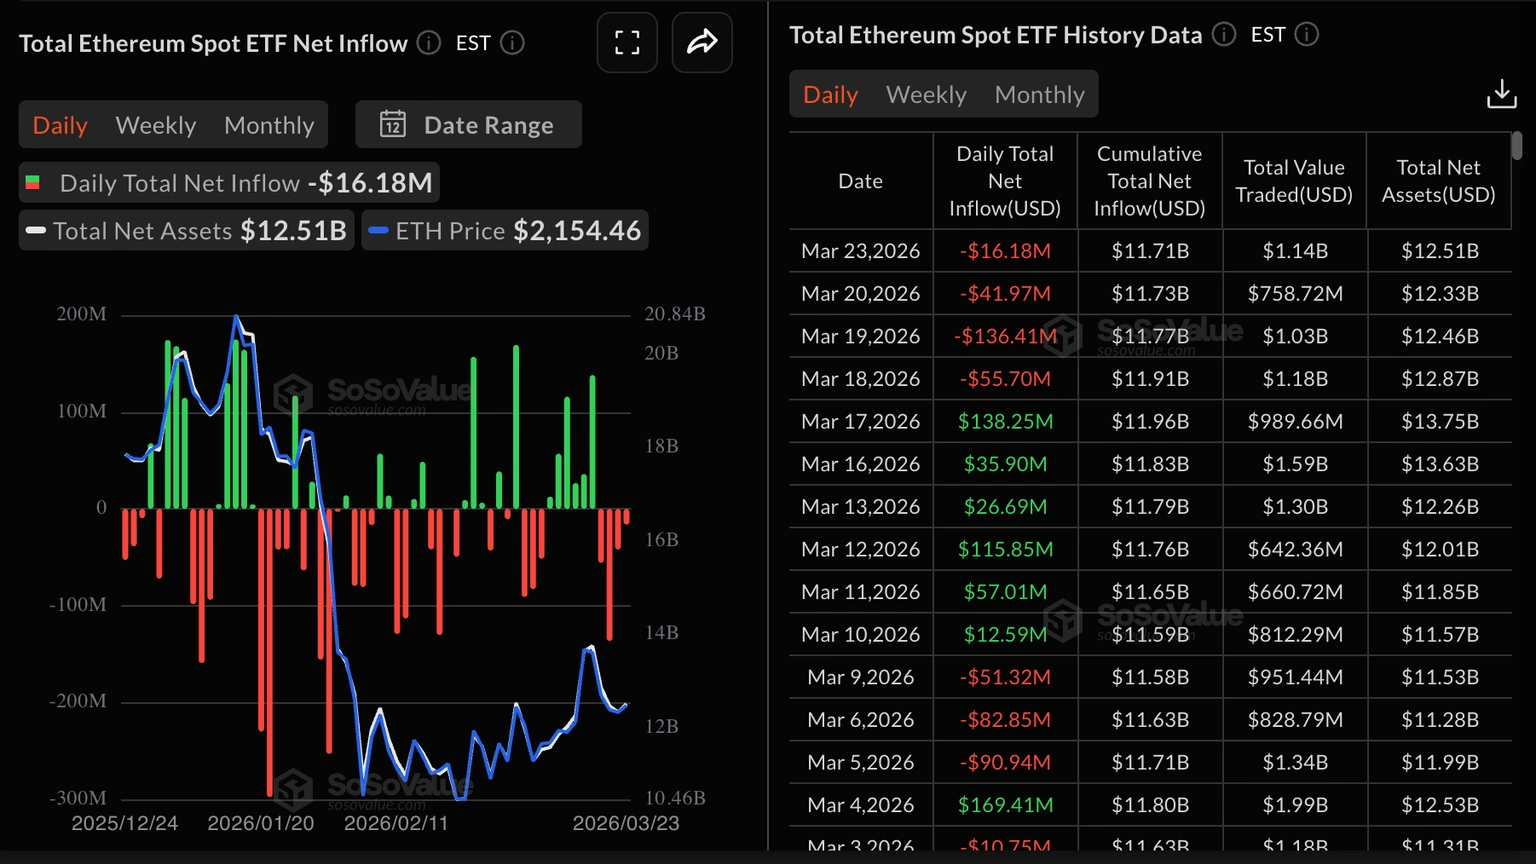
Exchange-traded funds (ETFs) listed on the U.S. spot market for the Ethereum network saw a shift toward net outflows, with investors selling approximately $192.1 million over the past two days. This move comes after six consecutive days of net inflows.
**Ethereum ETF flows. Source: SosoValue**
Markets are expected to maintain their downward bias as the weekend approaches, with nearly all asset classes declining at the start of the weekend.
**Ethereum Price Today: $2,130**
The leading altcoin experienced increasing bullish momentum in the first half of the week, accompanied by institutional buying, whale accumulation, and expanded interest in financial derivatives.
BitMine Immersion (BMNR), a company specializing in Ethereum treasury management, announced on Monday that it purchased 60,999 Ethereum, raising its holdings to 4.59 million Ethereum.
Whales (wallets holding between 10,000 and 100,000 Ethereum) also demonstrated strong accumulation, while retail traders continued to show weakness in trading activity.
**Ethereum balance by holder value. Source: Crypto Quant**
Notably, the Ethereum derivatives market saw renewed interest from long-term traders after open interest rose to its highest level since last September, while positive net flows continued among traders using market orders.
However, oil price volatility and diminishing expectations for interest rate cuts in 2026, driven by Middle East tensions, ultimately impacted the leading altcoin.
As a result, Ethereum experienced a decline near its implied price level or the cost of purchase on the blockchain, around $2,310, indicating that investors preferred to wait after reaching break-even. Historically, this level has triggered distribution activities in case of weakening uptrends.
Exchange-traded funds (ETFs) listed on the U.S. spot market for the Ethereum network saw a shift toward net outflows, with investors selling approximately $192.1 million over the past two days. This move comes after six consecutive days of net inflows.
**Ethereum ETF flows. Source: SosoValue**
Markets are expected to maintain their downward bias as the weekend approaches, with nearly all asset classes declining at the start of the weekend.