

12.19 Bitcoin Market Analysis
The weak pattern of Bitcoin remains unchanged, and a technical rebound may occur within the day.
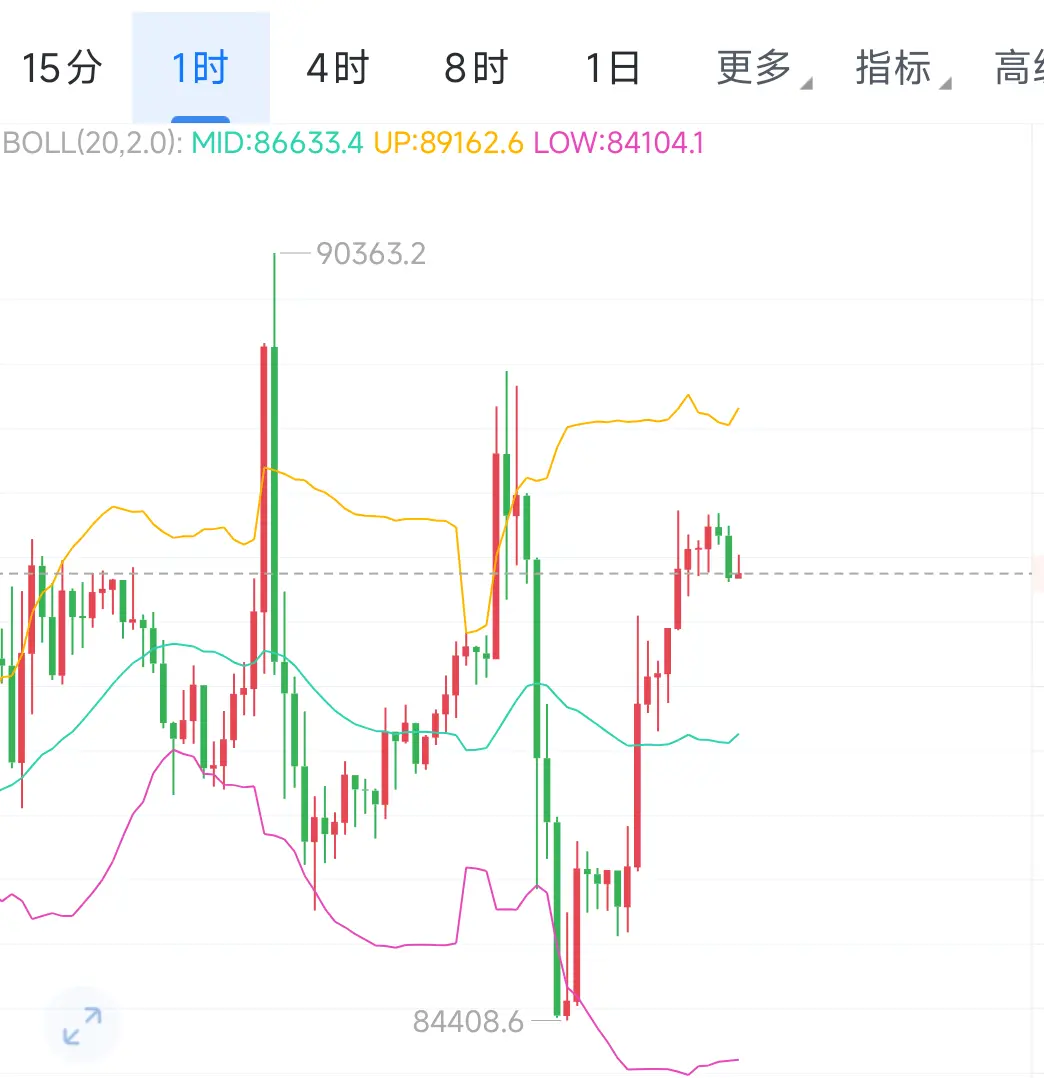
On the daily chart, Bitcoin has consecutively closed with two long upper shadow bearish candles, indicating a clear resistance trend. The price is operating near the lower Bollinger Band, highlighting its weak characteristics.
In terms of indicators, the KDJ lines are in the oversold zone with a slowing downward divergence, signaling a short-term oversold condition; the MACD lines remain in a death cross downward, with the green histogram unchanged. Trading volume has
View OriginalThe weak pattern of Bitcoin remains unchanged, and a technical rebound may occur within the day.
On the daily chart, Bitcoin has consecutively closed with two long upper shadow bearish candles, indicating a clear resistance trend. The price is operating near the lower Bollinger Band, highlighting its weak characteristics.
In terms of indicators, the KDJ lines are in the oversold zone with a slowing downward divergence, signaling a short-term oversold condition; the MACD lines remain in a death cross downward, with the green histogram unchanged. Trading volume has