
Ethereum (ETH) is facing the most severe structural challenges since its inception in the cryptocurrency market’s second-largest asset position. This threat is dominated by Tether’s stablecoin USDT, which has grown in market capitalization by 622.50% over the past five years, far exceeding Ethereum’s growth of approximately 11.75% during the same period. The global stablecoin market size has also surged from about $5 billion in 2020 to now $310 billion.
Five-Year Race Data Comparison: Growth Gap Reveals Structural Divergence
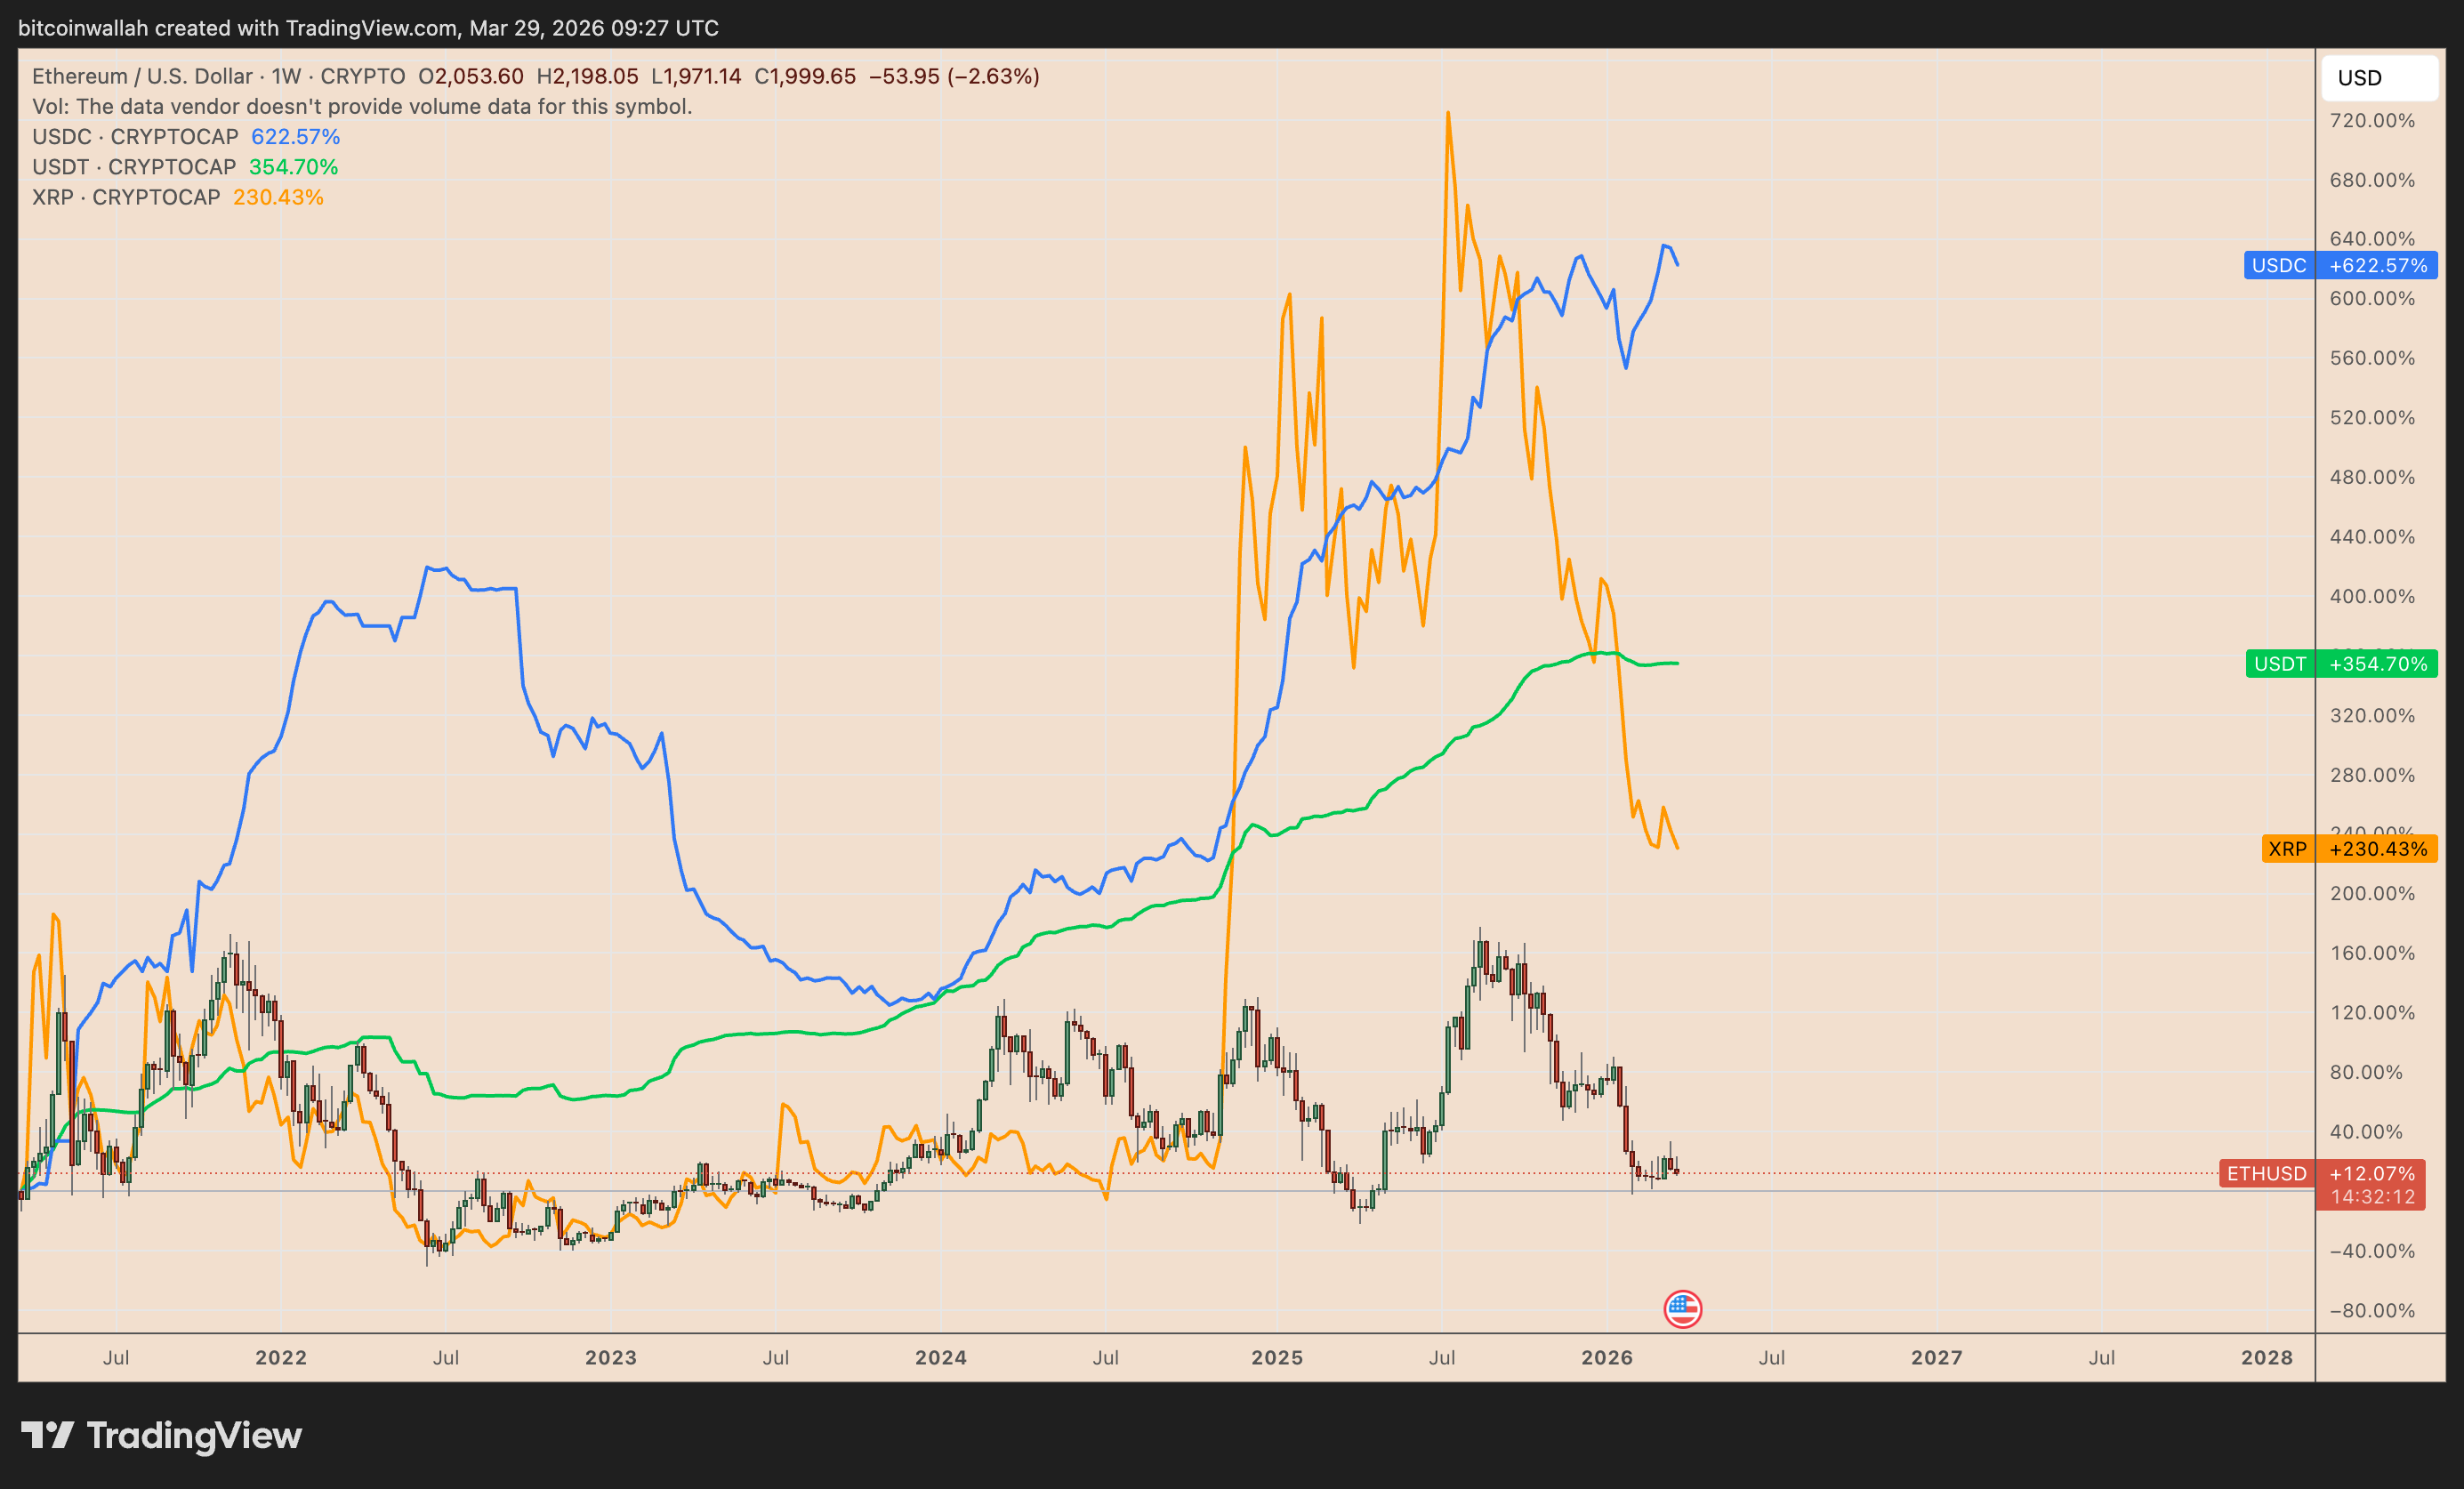 (Source: Trading View)
In specific numerical terms, Ethereum’s market capitalization has grown from about $21.5 billion to approximately $240 billion over the past five years, an increase of about 11.75%. During the same period, USDT’s market capitalization skyrocketed from about $25.5 billion to over $184 billion, with a growth rate of 622.50%. The growth rates of XRP and USDC have also surpassed Ethereum during the same period, indicating that ETH’s lag is not merely a temporary market fluctuation but reflects a deeper structural divergence.
The betting distribution on Polymarket reinforces the market consensus on this trend: the probability of a flip has surged from 17% in January to over 59% now, with the speed of market sentiment shift far exceeding most observers’ expectations.
Deep Reasons for Ethereum’s Lag: Fundamental Differences in Risk Appetite Logic
There are fundamental differences in the growth logic of ETH and USDT. Ethereum’s market capitalization heavily relies on rising ETH prices, requiring an overall recovery in market risk appetite to drive it; while USDT’s expansion stems from investors actively seeking “crypto dollars,” parking funds in stablecoins during risk-off periods or while waiting for entry opportunities, serving as dry powder. The current macro environment is evidently unfavorable for ETH:
Geopolitical Pressure: The ongoing U.S.-Iran conflict and uncertainty in the Middle East systematically suppress risk appetite.
Monetary Policy Shift: Expectations for rate cuts by the Federal Reserve have significantly cooled, with the market even starting to price in the possibility of rate hikes, directly compressing the valuation space for high-risk assets.
Continued Withdrawal of Institutional Funds: The assets under management of U.S. spot Ethereum ETFs have shrunk from $31.86 billion last October to $11.76 billion this March, a reduction of about 65%.
Tether’s market share in the global stablecoin market remains at 58%. In a risk-off environment, funds continue to flow into USDT rather than boosting ETH’s market capitalization, creating an irreversibly structural divergence between the two.
Technical Analysis: Bear Flag Pattern Confirmed, $1,250 as Key Downside Target
From a technical analysis perspective, Ethereum is currently exhibiting a typical bear flag pattern, with prices decisively breaking below the downward trend line, and downward momentum is strengthening. If the current downward trend continues, the technical downside target points to around $1,250, with the time window falling around June 2026.
This potential decline will further widen the gap between ETH’s market capitalization and that of USDT, providing additional technical support for the continuous rise in the flip probability. The weekly fund flows of U.S. spot Ethereum ETFs remain a key short-term indicator for assessing whether institutional confidence can rebound.
Frequently Asked Questions
What specifically does Ethereum’s “flip” refer to, and why does it not involve Bitcoin?
Here, “flip” refers to USDT’s market capitalization surpassing Ethereum, causing it to lose its position as the second-largest asset in the cryptocurrency market. This is entirely different from the concept of Ethereum surpassing Bitcoin in a “big flip,” which currently has a very low probability. The source of this threat is the rapid expansion of the stablecoin sector rather than competition from Bitcoin.
Why has USDT’s growth far outpaced Ethereum?
Ethereum’s market capitalization growth relies on rising market risk appetite and price increases; USDT, on the other hand, benefits from investors’ demand for safety, acting as a parking tool for funds during periods of heightened market volatility or while waiting for entry opportunities. The current defensive environment created by geopolitical risks and uncertainties in monetary policy naturally favors the expansion of stablecoins, which is detrimental to ETH’s market capitalization growth.
What impact does a 65% shrinkage in spot Ethereum ETFs have on future markets?
The assets under management of U.S. spot Ethereum ETFs have drastically shrunk from $31.86 billion to $11.76 billion, reflecting a continuous decline in institutional demand for ETH. ETF fund flows are an important forward-looking indicator of institutional confidence; ongoing net outflows could further pressure ETH’s market capitalization and accelerate the rise in Polymarket’s flip probability.
Disclaimer: The information on this page may come from third parties and does not represent the views or opinions of Gate. The content displayed on this page is for reference only and does not constitute any financial, investment, or legal advice. Gate does not guarantee the accuracy or completeness of the information and shall not be liable for any losses arising from the use of this information. Virtual asset investments carry high risks and are subject to significant price volatility. You may lose all of your invested principal. Please fully understand the relevant risks and make prudent decisions based on your own financial situation and risk tolerance. For details, please refer to
Disclaimer.
Related Articles
ETH drops 1.23% in 15 minutes: Retail’s concentrated sell-off and amplified ETF fund outflows weigh on the spot order book
2026-04-16 13:45 to 14:00 (UTC), ETH spot prices fell by 1.23% in just 15 minutes. The candlestick price range covered 2291.2 to 2336.98 USDT, with a swing of 1.96%. Market volatility intensified, sell pressure on the board became concentrated, and the trading community’s focus clearly shifted toward changes in capital outflows.
The main driver behind this abnormal move is large-scale, concentrated selling from retail. In the spot market, net outflows in the first 5 minutes reached as high as -$95.57M. Although some lead/major funds attempted to accumulate at lower prices (net inflows of +$18.95M in large orders over 5 minutes), the overall scale was limited and unable to effectively hedge the overall short-term selling pressure. Meanwhile, the ETH futures market did not show extreme liquidations or large-scale position closures, indicating that the core of the abnormal move came from a spot supply-and-demand imbalance rather than leveraged liquidation cascades.
In addition, ETH spot ETF funds have continued to experience net outflows in early April. On April 1, the single-day net outflow was $7.1M. The overall trend in Q1 was bearish, directly reflecting weakening institutional capital allocation intent and further undermining market confidence. Some funds have shifted to on-chain staking and emerging DeFi protocols. It is also worth noting that large holders with holdings in the 100,000-ETH range have continued to reduce their positions since the end of March. Whale capital outflows have persisted, and retail has followed the above signals, leading to a multi-factor selloff resonance effect in the short term. Although both the number of active addresses on the ETH chain and daily trading volume have hit historical highs, network usage and liquidity are overall strong, but capital flow has not formed any substantive spot buy orders, making it difficult to drive a price reversal.
At present, short-term market risk remains significant. Investors should pay attention to the strength of subsequent retail selling, the direction of ETF fund flows, and changes in large-holder positions. If large holders and major funds do not form a strong follow-through/acceptance, the spot market may continue to be affected by the release of structural supply. It is recommended that investors monitor key support zones in real time, track large on-chain fund movements, and watch for macro news developments, in order to reasonably mitigate the risk of short-term price fluctuations and promptly obtain more market information.
GateNews19m ago
ETH falls below 2300 USDT
Gate News bot message, Gate quotes show that ETH has fallen below 2300 USDT, with the current price at 2296.29 USDT.
CryptoRadar27m ago
Charles Schwab Launches Schwab Crypto Spot Trading for Bitcoin and Ethereum
Charles Schwab launched Schwab Crypto on April 16, a spot cryptocurrency trading service for retail customers. It supports direct trading of Bitcoin and Ethereum and offers education and support, integrating with existing financial services.
GateNews34m ago
Ethereum Foundation Funds $1M Audit Program for Smart Contract Developers
The Ethereum Foundation has launched a $1 million subsidy program designed to help Ethereum mainnet builders pay for professional smart contract security audits.
Key Takeaways:
The Ethereum Foundation launched a $1 million audit subsidy program on April 14, 2026, to help builders cover security r
Coinpedia1h ago
InterLink Launches Visa Card Supporting USDT and ETH Across 100M+ Merchants
InterLink has launched a Visa card allowing users to spend USDT and ETH at over 100 million merchants worldwide. It offers instant crypto-to-fiat conversion and integrates with mobile payment apps, enhancing the use of digital assets in daily transactions. Future updates will include support for InterLink's native tokens.
GateNews2h ago
