Author: Murphy
Since Coinbase’s BTC balance is closely related to ETF net inflows/outflows, I will pay more attention to Binance data as a closer reflection of actual demand (non-ETF) in the short term.
From Chart 1, we can see two obvious periods of balance increase during 10/21/2025-11/22/2025 and 1/15/2026-2/20/2026, which also correspond to two significant drops in BTC price. After 11/22/2025, the balance decreased by 34,145 coins, and BTC prices stabilized, shifting from rapid decline to consolidation and weak rebound.
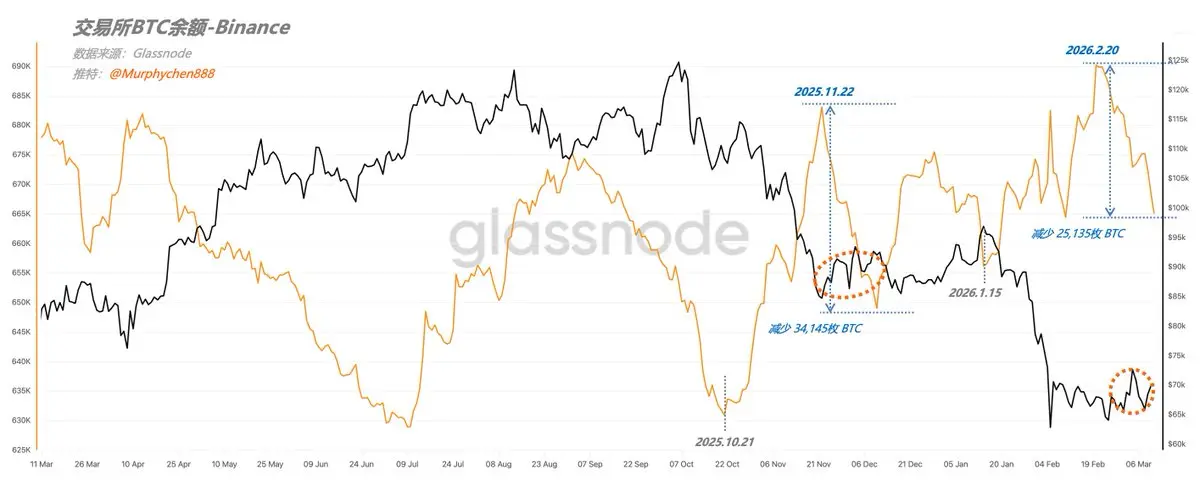
Chart 1: Binance BTC Balance
This pattern mirrors the current trend. Since 2/20/2026, Binance’s BTC balance has decreased by 25,135 coins, during which time the US-Iran military conflict occurred, yet BTC prices have remained relatively stable, with no major drop or surge.
Are these BTC transfers from Binance genuine demand? I personally believe “yes,” or at least “most of it.”
Because we can see structural differences from the “net transfer volume by scale.” During this period, the main outflows are not from single large accounts over $10 million, but rather from groups holding between $1 million and $10 million.
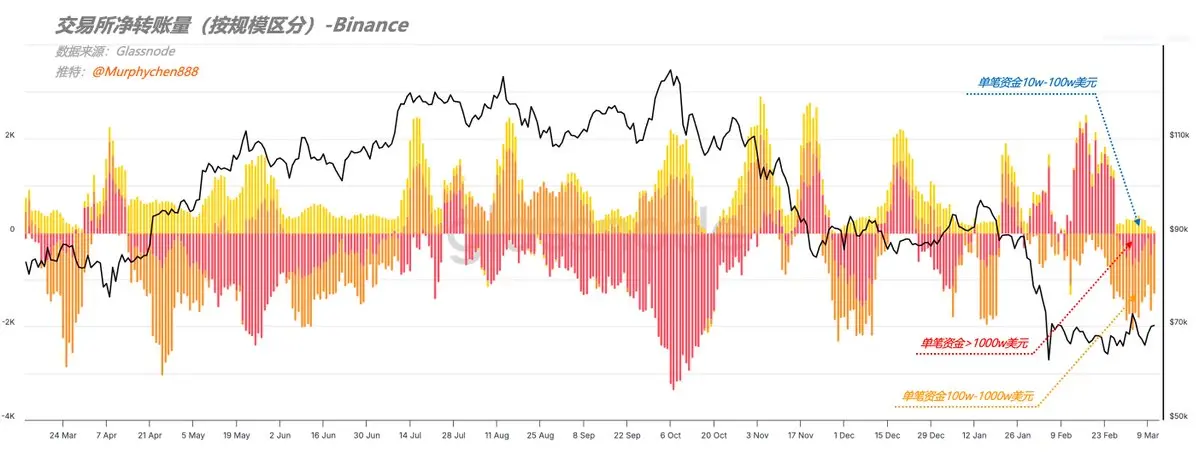
Chart 2: Binance Net Transfer Volume (by scale)
We know that large accounts often include market makers, custodians, and institutional players, while the $1 million-$10 million group is more likely high-net-worth investors and individual whales accumulating chips.
Additionally, from Binance’s BTC spot trading volume deviation (CVD), we observe a very steep curve. CVD measures the net difference between buy and sell trading volumes, especially highlighting when buyers or sellers actively initiate trades.
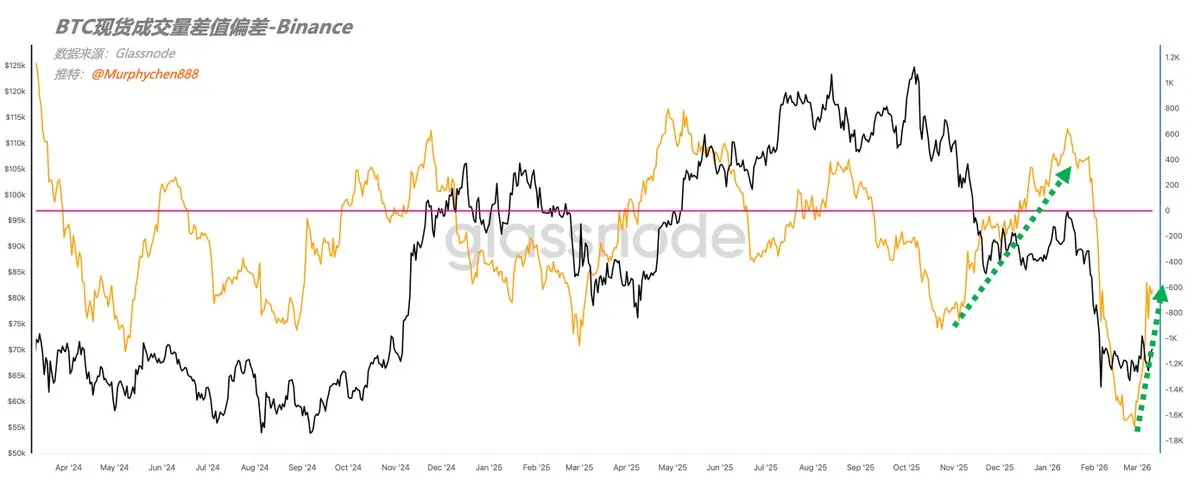
Chart 3: BTC Spot Trading Volume Deviation (Binance)
The algorithm I use compares the 30-day moving average against the 90-day median, which smooths out daily fluctuations and reduces noise. A steep curve indicates that active buy orders are significantly stronger during this period.
This also somewhat supports the earlier hypothesis—that current demand is more aligned with real market needs rather than market maker activity. Moreover, the recent USDC/USDT exchange rate has fallen from high levels to below 1, indicating that demand using USDT as purchasing power is increasing.
This explains why, despite ongoing US-Iran military tensions and rising concerns about stagflation or recession, BTC prices have remained relatively stable.
Of course, these are short-term data observations. When viewed from a higher dimension, you will find that on a macro level, CVD remains in an overall downward trend, similar to the trend before May 2022.
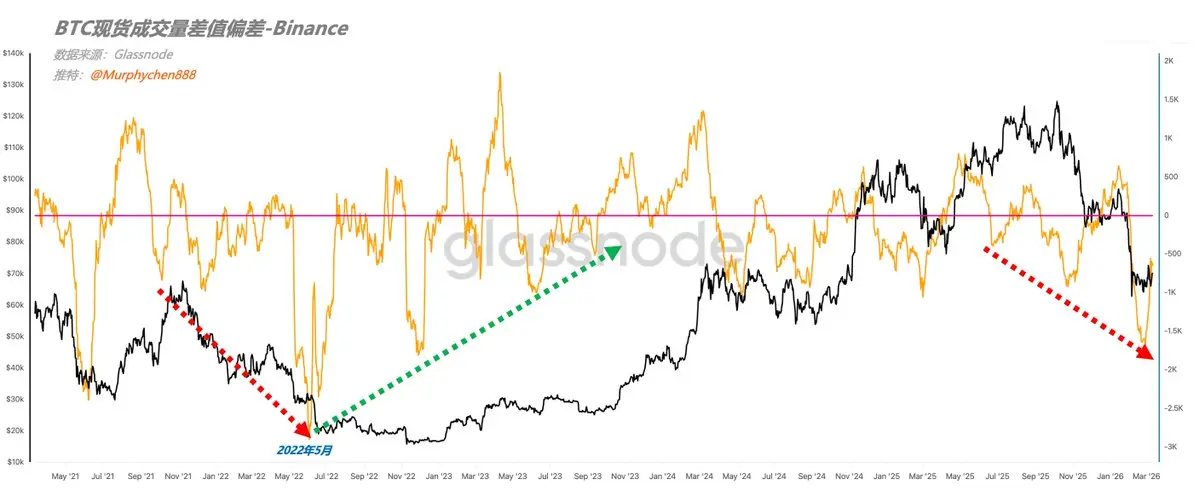
Chart 4: BTC Spot Trading Volume Deviation (Binance)
After May 2022, the CVD curve started to diverge from the price, with the lows gradually rising, moving from a significant deviation from the 90-day median to increasingly approaching it. This indicates that active buy demand is beginning to recover, and demand is regaining strength. Of course, this will be a long process of transition.
Coupled with the recent cautious attitude of on-chain whale entities towards macro certainty, my view is: in the short term, phased demand absorption may keep BTC in consolidation or weak rebound; but from a longer-term perspective, the overall trend remains downward; current demand recovery is still in early stages, and a longer structural repair process may be needed.
Disclaimer: The information on this page may come from third parties and does not represent the views or opinions of Gate. The content displayed on this page is for reference only and does not constitute any financial, investment, or legal advice. Gate does not guarantee the accuracy or completeness of the information and shall not be liable for any losses arising from the use of this information. Virtual asset investments carry high risks and are subject to significant price volatility. You may lose all of your invested principal. Please fully understand the relevant risks and make prudent decisions based on your own financial situation and risk tolerance. For details, please refer to
Disclaimer.
Related Articles
BTC breaks through 75000 USDT
Gate News bot message, Gate market data shows, BTC breaks through 75000 USDT, current price is 75003.9 USDT.
CryptoRadar22m ago
Traditional Brokerage to Launch Spot Bitcoin and Ethereum Trading in Coming Weeks at 0.75% Fee
A traditional brokerage is set to launch spot cryptocurrency trading for retail clients, offering Bitcoin and Ethereum access. The service will include multiple trading platforms, a 0.75% fee, and additional crypto assets planned for the future, reflecting a trend of traditional finance entering the crypto space.
GateNews1h ago
Bhutan Sells $18.46M Bitcoin as Price Nears $74k Resistance
The Royal Government of Bhutan transferred approximately 250 BTC worth $18.46 million in the past 24 hours, according to on-chain data from Arkham, continuing a broader pattern of reduced Bitcoin holdings. The transfers included 162 BTC and 69.7 BTC sent to new wallet addresses within a short
CryptoFrontier1h ago
Bitcoin's BIP-361 Quantum Fix Splits Community Over Address Freezing
A proposed Bitcoin improvement to address quantum vulnerability has divided the cryptocurrency community over whether to freeze legacy addresses, including those attributed to Satoshi Nakamoto. The BIP-361 proposal, which went live on April 14, has sparked debate between prominent figures including
CryptoFrontier2h ago
Zonda Exchange Discloses 4,500 BTC Cold Wallet as Private Keys Remain Untransferred
Zonda, a Polish crypto exchange, revealed a cold wallet with 4,503 BTC amid a withdrawal crisis. CEO Przemysław Kral addressed fund misappropriation allegations and promised legal action against false claims, emphasizing that private keys were never transferred due to the former CEO's disappearance.
GateNews2h ago
