CoinDesk senior analyst James Van Straten points out that Bitcoin has experienced the longest miner capitulation in history. As the Hash Ribbon approaches a golden cross, multiple indicators suggest the market has entered a deep value zone, and the darkest decline may be over.
(Background: Michael Saylor: Bitcoin’s 45% retracement is like Apple’s “Valley of Despair”)
(Additional context: Female investor Cathie Wood: Bitcoin is “undoubtedly” superior to gold and has more structural advantages in the modern financial system)
After a three-month period of volatility and decline, Bitcoin (BTC) is showing key reversal signals. According to data from on-chain analytics firm Glassnode, cited by CoinDesk senior analyst James Van Straten, the Hash Ribbon indicator is recovering, indicating that the longest miner capitulation phase since November last year may be ending. Historical data shows that such signals often precede market bottoms.
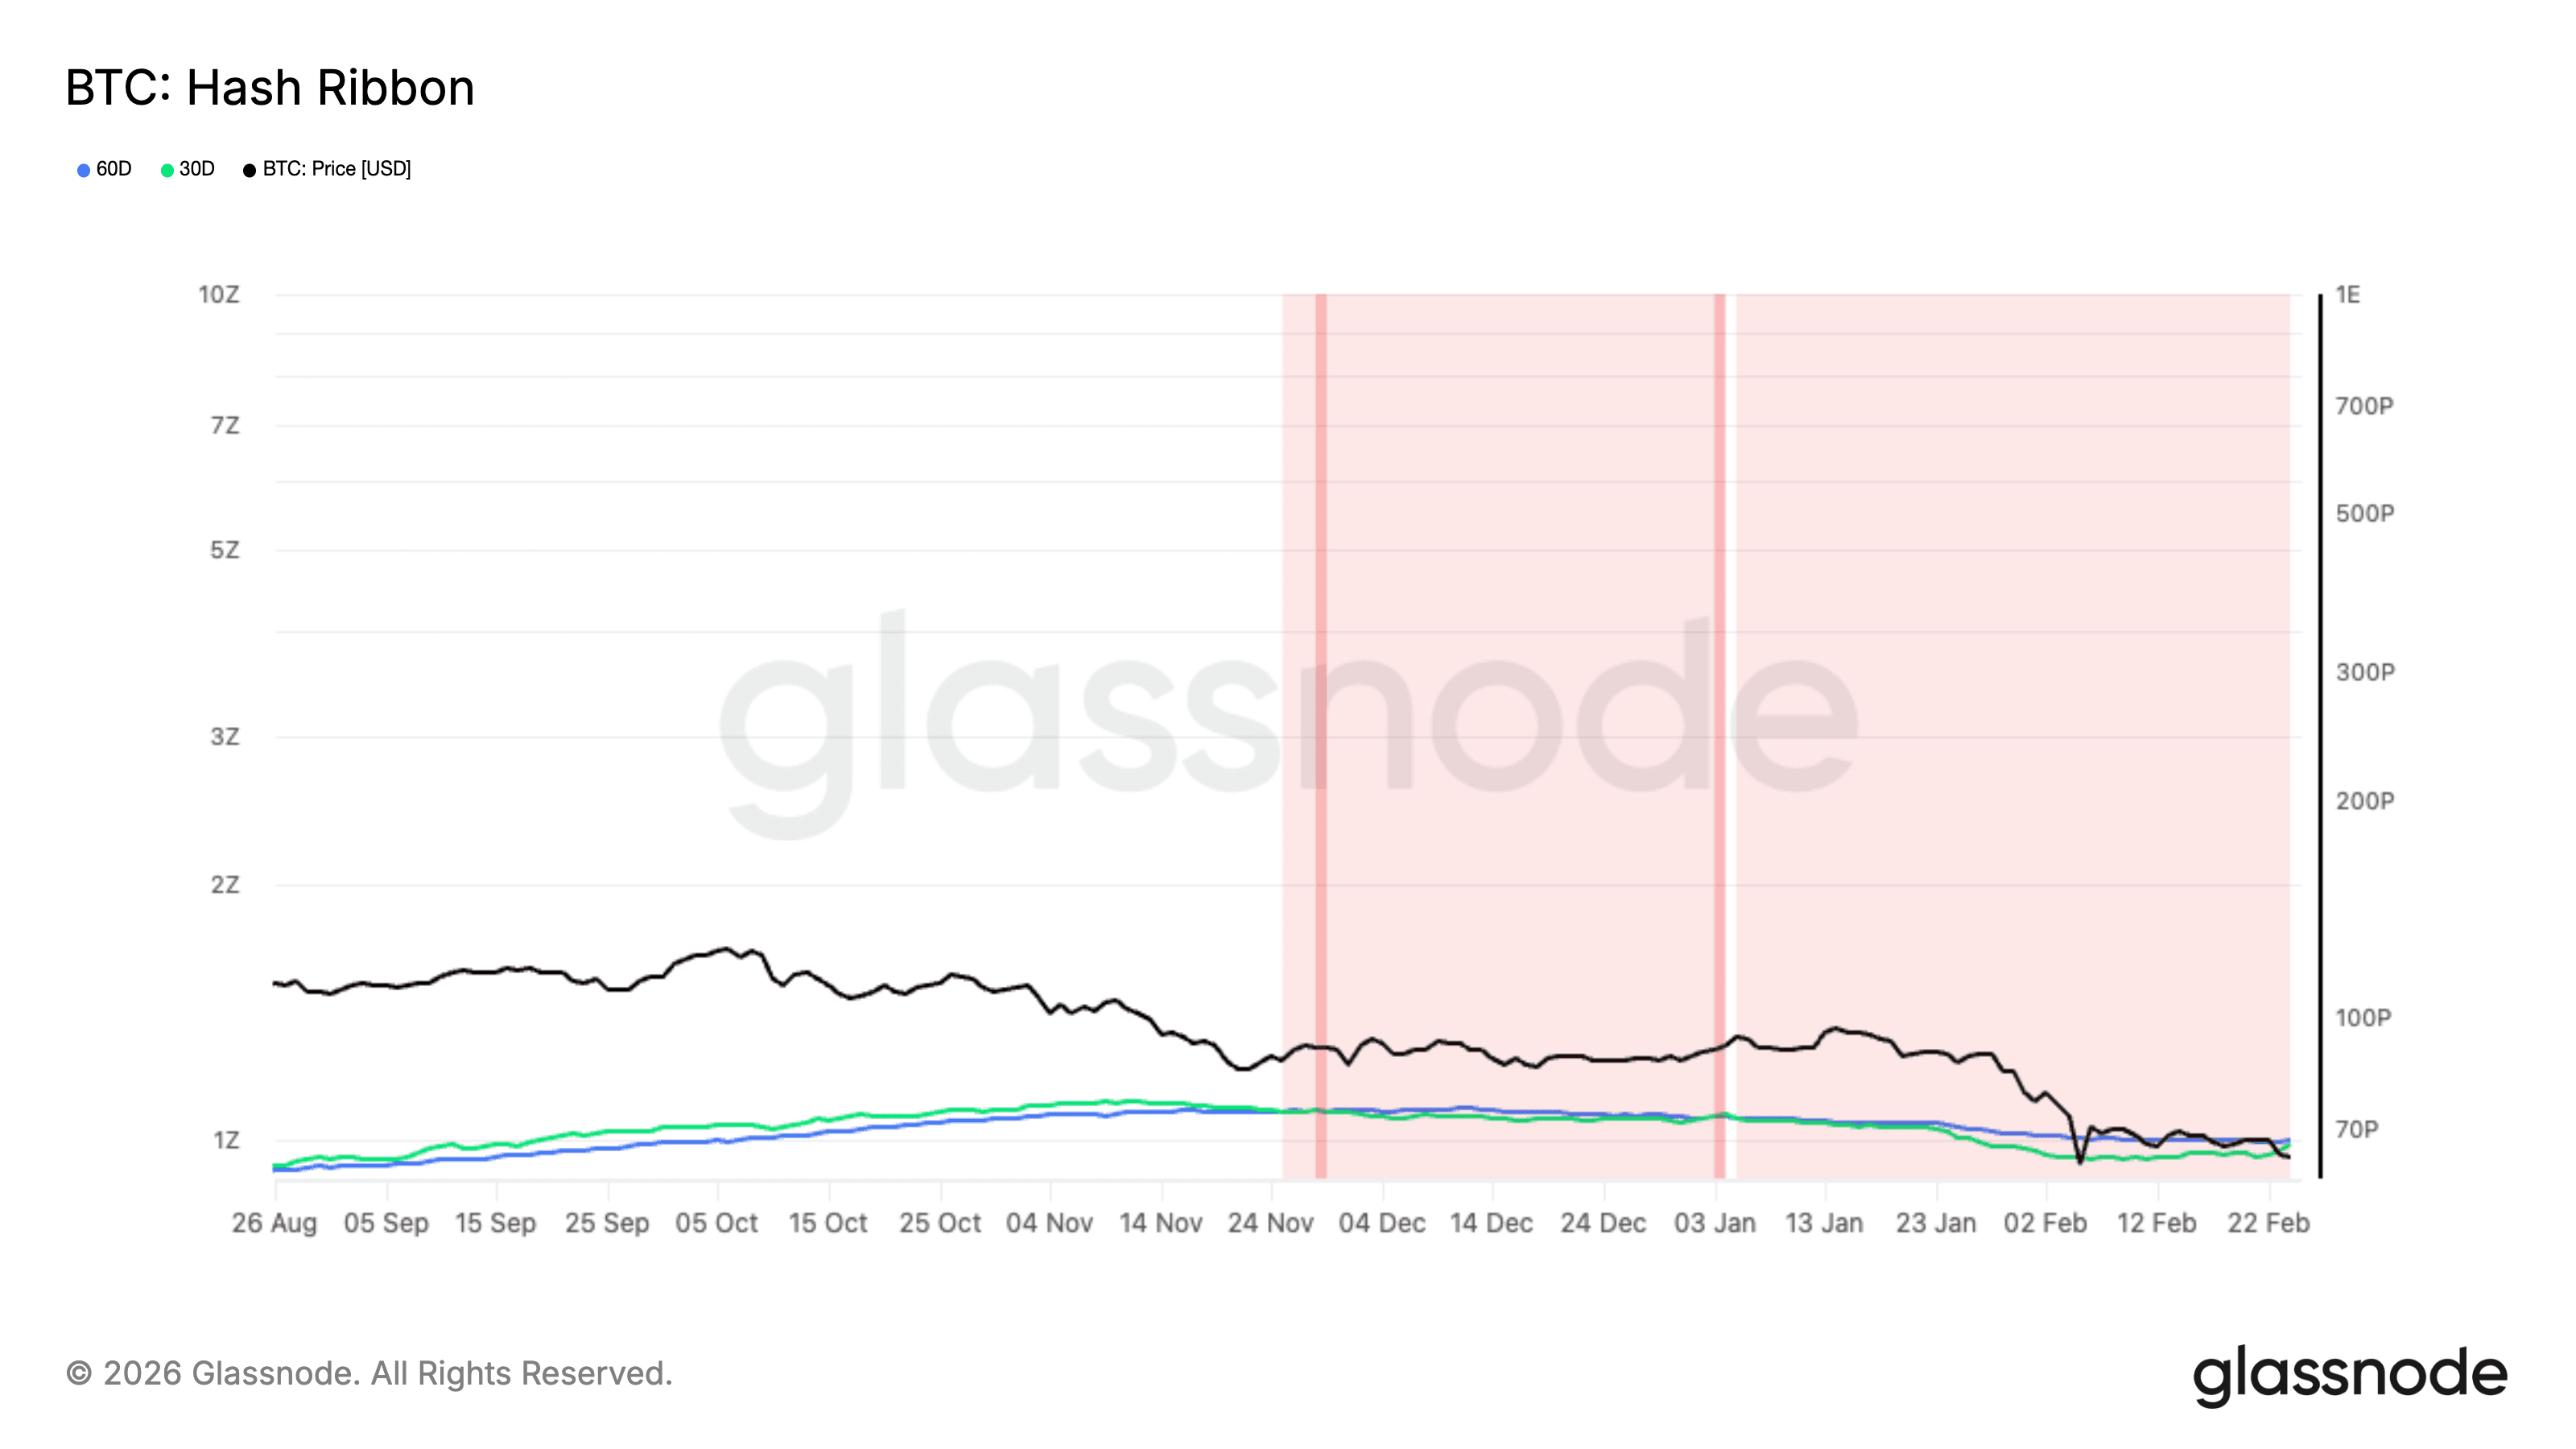
Image source: James Van Straten
What is “Miner Capitulation” and Why Is It Related to Price Bottoms?
In the cryptocurrency market, “miner capitulation” occurs when mining revenues are insufficient to cover electricity and operational costs, forcing inefficient miners to shut down equipment and sell their Bitcoin holdings to stay afloat. This collective selling pressure often causes the network’s hash rate to temporarily decline.
The Hash Ribbon indicator tracks the 30-day and 60-day moving averages (MA) of hash rate to assess market stress. When the 30-day MA crosses above the 60-day MA, it signals miners are coming back online, easing network pressure. Over the past decade, such crossovers have accurately marked important market lows, including those at the end of 2018 and 2022.
Data Analysis: Price Has Fallen Below “Average Production Cost”
In addition to the hash rate indicator, another piece of evidence supporting a bottom is Bitcoin’s production cost. Van Straten cites data from checkonchain, indicating that Bitcoin’s current trading price (around $65,000–$66,000) is below the estimated average production cost of $66,000.
When Bitcoin’s price drops below production costs, the market is generally considered to be in a “deep value zone.” This phenomenon is rare; the last time it occurred was in November 2022, when Bitcoin hit a cycle low of $15,500. Currently, the price falling below the cost line will further shake out the last weak holders, completing the capitulation process.

Disclaimer: The information on this page may come from third parties and does not represent the views or opinions of Gate. The content displayed on this page is for reference only and does not constitute any financial, investment, or legal advice. Gate does not guarantee the accuracy or completeness of the information and shall not be liable for any losses arising from the use of this information. Virtual asset investments carry high risks and are subject to significant price volatility. You may lose all of your invested principal. Please fully understand the relevant risks and make prudent decisions based on your own financial situation and risk tolerance. For details, please refer to
Disclaimer.
Related Articles
ETH 15-minute rise of 0.59%: ETF event expectations drive the intraday upward move
From 2026-03-31 13:45 to 14:00 (UTC), the ETH spot market recorded a +0.59% return. The price ranged from 2063.14 to 2079.88 USDT, with a volatility of 0.81%. During this period, market fluctuations slightly increased, activity became more prominent, and ETF-related events drew market attention. Traders’ sentiment focused on the upcoming capital flows associated with these events.
The main driver behind this movement was related to ETH ETF market developments. On March 31, 2026, regarding “Ethereum ETF Flo” (the original text is incomplete here, but the translation continues with the full content), the market reacted to the news and expectations surrounding the approval and launch of Ethereum ETFs, which influenced trading behavior and sentiment.
GateNews32m ago
Downside risk remains as bitcoin nears record-tying six-month losing streak
Bitcoin is nearing a record of six consecutive monthly losses, with declines in October, November, and December. While current support levels are holding, macroeconomic factors and ongoing conflicts pose risks to recovery.
CoinDesk53m ago
BTC Price Plunges to 3-Week Low as Analysts Map Out Next Downside Targets
The first breakdown to under $68,000 seemed as just the beginning for bitcoin’s Friday correction, which just worsened with another dip to a fresh 3-week low.
Most altcoins have followed suit, which has harmed over-leveraged traders, with more than 120,000 such participants being wrecked in the
CryptoPotato1h ago
Bitcoin Cash and NEAR Protocol lead CoinDesk 20 as the market trades sideways
Bitcoin Cash and NEAR Protocol emerged as leaders in the CoinDesk 20 index as the cryptocurrency market remained stagnant. While the index showed no significant movement, BCH increased by 1.5% and NEAR by 1.9%, indicating selective investor interest despite overall market caution.
TapChiBitcoin1h ago
ETH 15-minute price up 0.61%: Active buying comes in, and a breakout above a key level in tandem boosts short-term performance
2026-03-31 13:00 to 13:15 (UTC), ETH fluctuated within the 2047.63 to 2061.18 USDT range. The 15-minute candlestick return recorded +0.61%, with a range of 0.66%. During this period, market attention clearly increased; short-term long sentiment edged upward, volatility intensified, and it attracted incremental liquidity to enter.
The main drivers behind this anomaly are a slight uptick in on-chain trading volume and the emergence of aggressive buy orders. ETH’s on-chain average daily number of transactions remained at a high level of 2,000,000. In the window, spot market trading volume increased, and on-chain transfers accounted for a significant portion of the activity, reflecting increased market participation and liquidity inflows.
GateNews1h ago
Ripple Price Analysis: XRP Enters Q2 With No Bullish Reversal Signs
XRP is wrapping up Q1 2026 at around $1.30, sitting near its lowest levels in the past couple of years. The altcoin has shed the vast majority of its gains from the cycle peak and continues to bleed against both the dollar and Bitcoin. And the worst news? There is no technical sign of a reversal as
CryptoPotato1h ago
