
Author: SOL Who Can’t Understand
After losing 20 million, I finally understand that when investing in A-shares, the key is to escape the top; when investing in U.S. stocks, the key is to buy the bottom.
Escaping the top in A-shares, especially the major peak, is the easiest but also the most difficult. The reason it’s easy is that the top in A-shares is a typical crowded peak; in hindsight, it’s almost as if the words “major top” are written on the candlestick chart.
The reason it’s difficult is that in A-shares, you can only make money by going long, and since the stock market generally rises over the long term, escaping the top is akin to locking in gains. It doesn’t generate profit by itself, and human nature is greed.
In comparison, the most important thing in U.S. stocks is to buy the bottom. Over nearly 20 years of market observation, buying on dips is the most crucial investment rule.
In other words, if you’ve already invested money, the simple approach is to hold steadily; the key question is when new money should buy the bottom. And in U.S. stocks, the easiest and most difficult part is also buying the bottom.
The reason it’s easy is that buying the bottom in U.S. stocks is “small dips buy small, big dips buy big, no dips, no buy.”
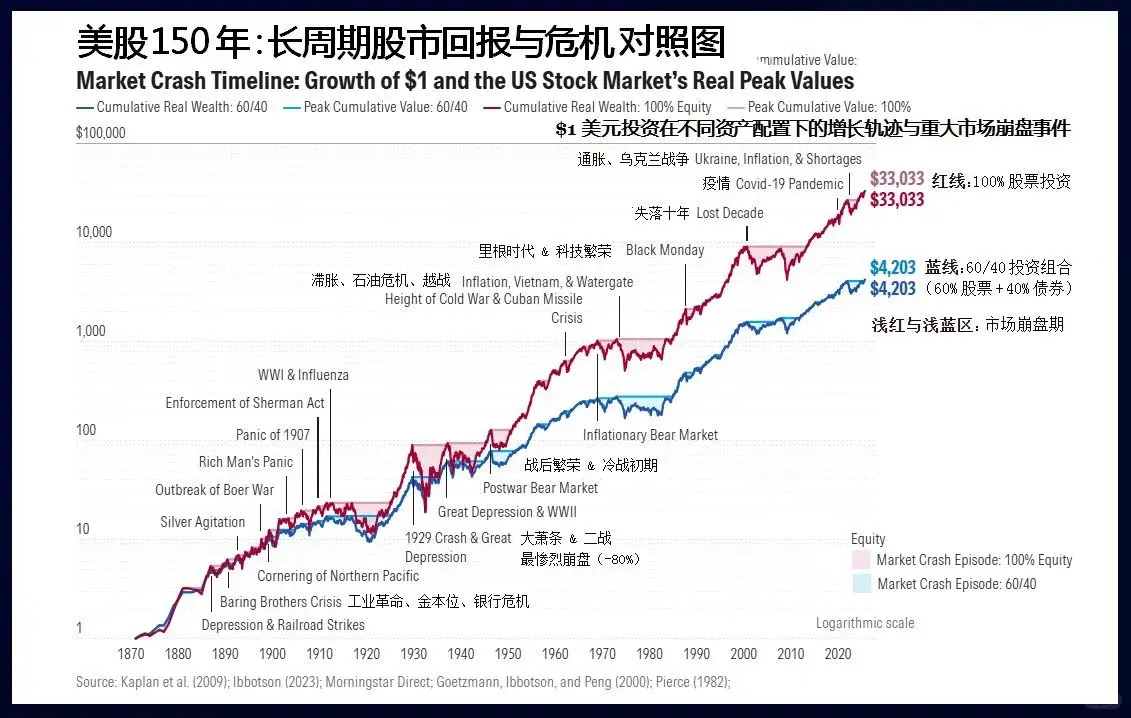
Since 1776, all those betting against America have ultimately ended in their own failure.
The reason it’s the most difficult is that most people transfer from “buying the bottom in the middle of the climb” in A-shares, suffering from “bottom-fishing syndrome,” always wanting to buy lower for a safety margin. As a result, they hesitate to buy during declines and chase after rebounds.
Therefore, when opportunities to buy the bottom in U.S. stocks appear, everyone must clarify two questions:
1. Under normal circumstances, how much does a U.S. stock correction typically fall?
2. If a black swan event occurs and the decline continues endlessly, what should we do?
1. How deep are U.S. stock corrections? First, let’s define what “correction” means.
Typically, corrections are categorized into daily, weekly, and monthly levels. A correction in a cycle meets either one of two conditions (everyone’s definitions may vary; these are my standards):
- Daily level: a decline of more than 5% from the peak, or lasting more than two weeks (referring to the time span from the highest to the lowest point);
- Weekly level: a decline of more than 10% from the peak, or lasting more than 4 weeks;
- Monthly level: a decline of more than 15% from the peak, or lasting more than 4 months.
Meeting either one of these conditions qualifies. Some corrections are shallow in magnitude but prolonged in time; others are the opposite. Once the definition is clear, the goal of buying the bottom boils down to two objectives:
- Objective 1: Accumulate the desired position.
- Objective 2: Buy as cheaply as possible.
Markets always look back with clarity. When we are confused and a wave of correction is happening, we can only be certain of two things—how much the previous high has fallen today, and how many days it has taken.
The market may continue to fall, consolidate, or rebound later.
Thus, these two objectives are in conflict: buying too early may fulfill objective one but at a higher price; if you focus on buying cheaply, you might miss the rebound and see prices rise.
This requires us to have a probabilistic understanding of historical correction depths in U.S. stocks to set reasonable targets.
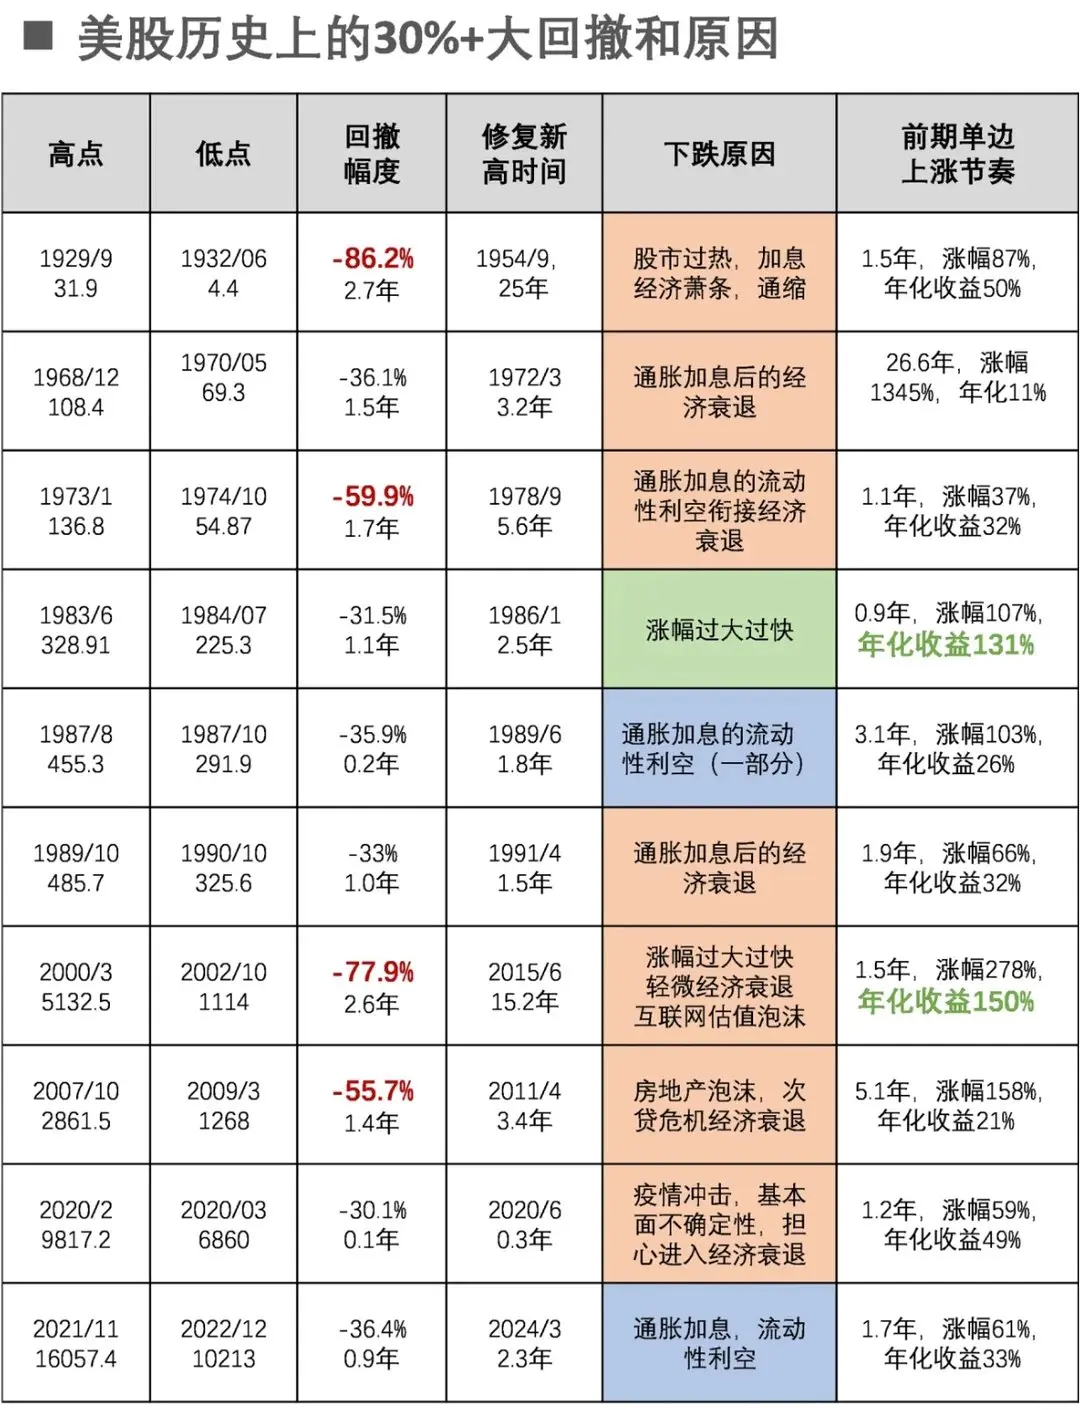
Historical 30%+ Major Drawdowns in U.S. Stocks and Their Causes
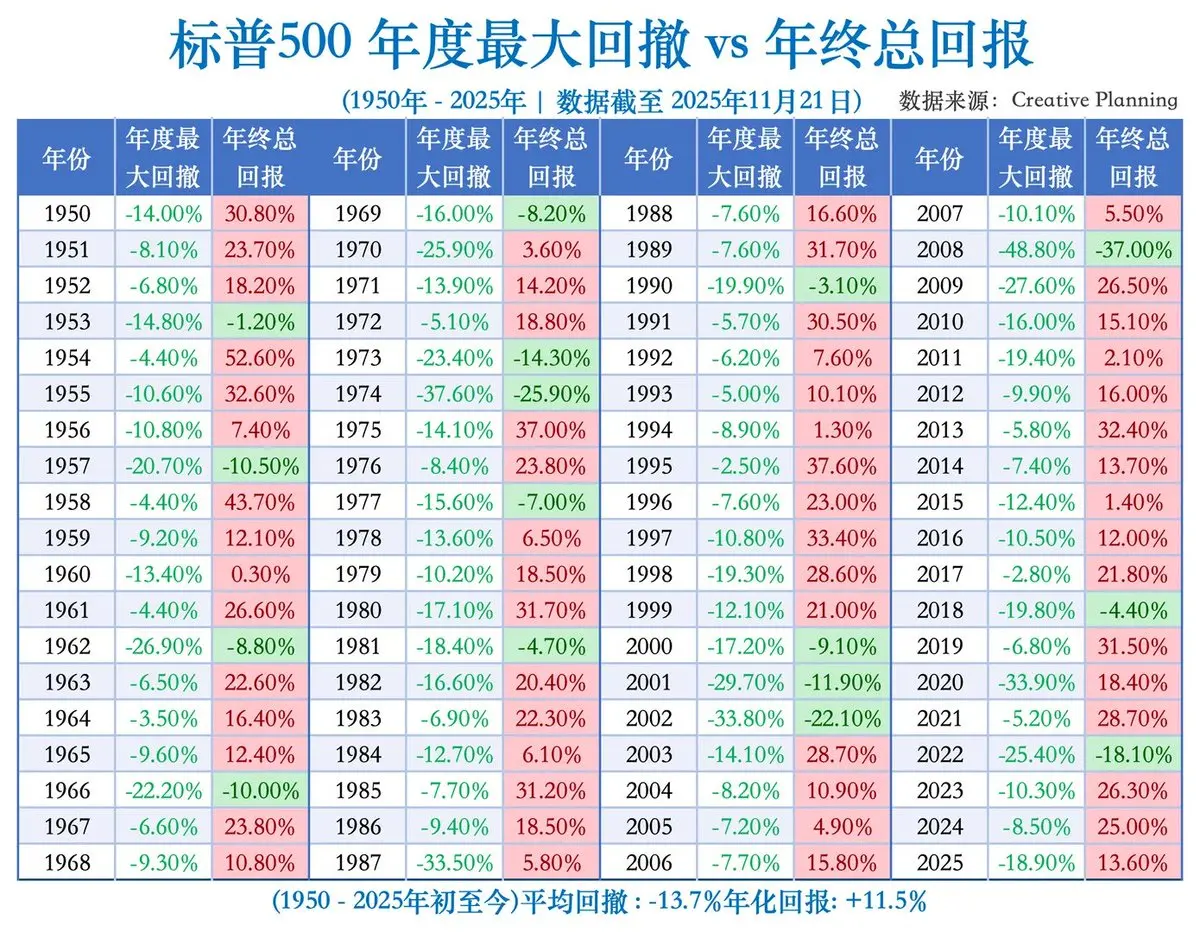
Taking the S&P 500 Index as an example, over the past 20 years (since 2004), there have been only 7 corrections at the monthly level. The causes include:
- January–October 2022: the most intense rate hike cycle in 40 years
- February–March 2020: global public health crisis
- September–December 2018: trade war combined with rate hikes
- July 2015–February 2016: central economic slowdown plus rate hike expectations
- April–September 2011: deepening European debt crisis
- April–June 2010: European debt crisis and Goldman Sachs fraud scandal
- October 2007–March 2009: subprime mortgage crisis
Thus, monthly corrections in U.S. stocks are quite rare, averaging about once every three years, each driven by macroeconomic fundamentals. Notably, from September 2011 to July 2015 (44 months), there was no correction, indicating a long bull run.
Weekly corrections occur more frequently—about 2–3 times per year—and do not necessarily require macroeconomic reasons; overbought conditions can trigger corrections.
Therefore, when buying the bottom, the first step is to determine whether this correction is at the weekly or monthly level.
However, stock movements are influenced by various news and are hard to predict precisely. The Federal Reserve isn’t your family; bad news and good news won’t arrive according to your plan—fortunately, you can set your own targets.
You need to consider: if you had to choose between “buy now” and “buy cheap,” which would you prefer?
If you choose “buy now,” then you should assume the correction is at the weekly level and plan accordingly. Even if a monthly correction occurs later, you can still achieve your first goal. Conversely, if your goal is “buy cheap,” you should prepare a bottom-fishing plan based on monthly corrections.
But generally, I recommend prioritizing “buy now,” especially when you have idle funds. Monthly corrections happen roughly once every three years, so the probability isn’t high. Plus, if you have cash but can’t buy U.S. stocks, you might end up investing in other high-risk products.
With a clear goal, the plan becomes much simpler.
2. Timing and positioning plans: When should you start buying U.S. stocks?
Using weekly correction as an example, as long as two weeks pass without a new high, it indicates a daily-level correction is underway, and you should prepare a cycle-level bottom-fishing plan.
The core of U.S. stock bottom-fishing is two words—batching.
There are two types of batching plans: time-based batching, where you buy at intervals over time, and position-based batching, where you buy once the price drops to a certain level. Based on the past 20 years, the average time from peak to bottom at the weekly level (excluding monthly corrections) is about 10 weeks. So, a time-based batching plan could be to buy every three weeks, starting from the high point, with longer intervals between the first and second purchases.
Position-based batching can also be divided into three parts: buy one batch after a 3% decline, and if the decline reaches 10%, you can complete the entire bottom-fishing plan.
The success probabilities of these two plans differ: time-based batching is generally more reliable. Unless the correction is only at the daily level and a new high occurs quickly, which would be a missed opportunity but still a chance to add positions during a daily correction.
However, position-based batching may not always be feasible, as many weekly corrections are prolonged but do not reach a 10% decline.
For weekly corrections aiming at “completing the bottom-fishing,” priority should be given to “time-based batching,” meaning that once the correction duration reaches the planned period, you execute the batch purchases, regardless of the decline percentage.
For monthly corrections, the average time to bottom is about 6.5 months, but with large variance. So, adopt a “high probability of incomplete” approach—buy what you can, as much as possible.
Position sizes should not be evenly distributed; instead, start with larger positions and reduce over time. For example, three batches could be 1/2, 1/3, and 1/6 of the total planned position.
Time-based plans can be divided into: the first month, the third month, and the sixth month. Position-based plans can be: decline of 3%, 8%, and 15%. Often, when targeting monthly corrections, the actual execution ends up being a weekly correction plan with insufficient volume. Therefore, I still recommend focusing primarily on weekly correction plans.
In summary, three do’s and three don’ts for bottom-fishing U.S. stocks:
- Do plan in batches; avoid decision-making based on intraday emotions or impulsive trading.
- Prioritize “buy enough,” with “buy cheap” as a secondary goal.
- Focus on “time-based batching,” with “position-based batching” as a supplement.
U.S. stock bottom-fishing is a very mechanical process. The long-term upward trend and relatively low volatility of U.S. stocks are prerequisites for this plan.
But stocks are ultimately a game of human nature, and the economy itself has unpredictable elements. Black swan events can happen at any time—and will.
If the correction’s timing or depth exceeds your plan, how should you respond? And if a black swan event occurs, what then?
3. Black Swan Events
The above correction classifications based on monthly and weekly levels are clear and standard. However, even within the same monthly correction, the severity can vary greatly. For example, the 2008 financial crisis and the 2020 pandemic were both economic crises rather than typical stock corrections.
Market adjustments can be categorized by cause:
1. Natural correction due to excessive accumulated gains, with macro fundamentals still generally positive—most daily and weekly corrections fall into this category.
2. Valuation overextension combined with economic recession or rate policy turning dovish, leading to corrections—a minority of weekly and most monthly corrections.
3. Systemic risks causing economic crises or deep recessions—a few monthly corrections or prolonged bear markets, such as the 2008 crisis and 2020 pandemic.
In the past 20 years, the 2008 subprime mortgage crisis and the 2020 health crisis both belong to the third category. The former fell 58% over more than a year; the latter dropped 35% in two months. These are beyond our typical bottom-fishing plans and require separate analysis.
However, crises and corrections initially look similar. When the market started declining in 2007, it was seen as a recession. After the Fed began cutting rates, stocks rebounded, and by early 2008, investors were aggressively bottom-fishing.
Therefore, during the bottom-fishing process, you must continuously observe whether new developments or worsening factors emerge that differ from initial decline signals.
For example, in recent deep declines: a bear market like 2022, with a 27% drop in a year, is easier to identify because it aligns with macro logic—everyone discusses rate hikes, inflation is soaring, and economic data worsens month by month. The bottom might be confirmed early, but the decline is a prolonged process.
Similarly, the 36% plunge in one month during the 2020 pandemic was triggered by an extraordinary black swan event, driven by non-economic factors. It was panic-driven but short-lived; once the panic subsides, the decline ends. In such cases, patience is key.
The most challenging was the 58% drop during the 2008 financial crisis, which was a mix of the two scenarios—an economic crisis triggered by a systemic event, leading to a deep bear market. It was unpredictable and required specific responses.
Looking further back, the 2000 dot-com bubble burst was a rare valuation-driven crash that also dragged down the economy. Valuations at that time were far higher than today, making it a recognizable “gray rhinoceros” event, but few wanted to “get off the bus” early.
In summary, avoid trying to predict U.S. stock declines in advance. The most important thing is to face reality directly: after the decline occurs, respond accordingly. The sky won’t fall—it’s about managing the situation as it unfolds.
