
Key Takeaways
-
Hyperliquid’s HIP-3 markets hit record highs, with daily trading volume surging to around $1.47 billion.
-
Open interest (OI) reached an all-time high of $793 million, up sharply from $260 million just a month ago.
-
Rising commodities trading activity is driving strong capital inflows into the Hyperliquid ecosystem.
-
The daily chart highlights a Bearish Shark harmonic pattern, allowing room for short-term upside.
Hyperliquid’s native token HYPE is back in focus after posting a sharp 20%+ rally, pushing price toward the $26.80 level. While the move itself has caught traders’ attention, a closer look at on-chain growth and chart structure suggests this momentum may be backed by more than just short-term speculation.
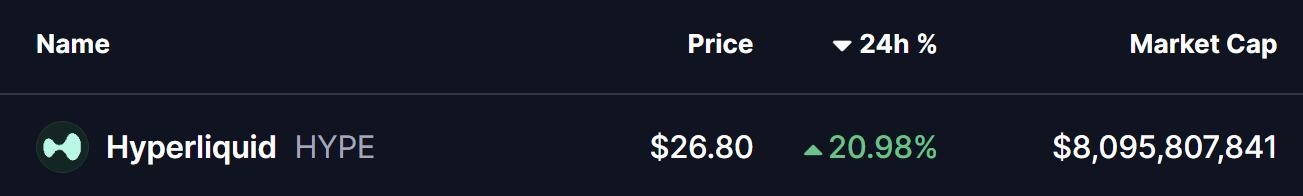
Source: Coinmarketcap
Hyperliquid’s HIP-3 Markets Hit Record Highs
According to the latest data from Flowscan, Hyperliquid’s HIP-3 protocol — launched last fall to allow builders to deploy on-chain markets for commodities like gold and silver — is seeing explosive growth.
Daily trading volume across HIP-3 markets has surged to around $1.47 billion, marking a new all-time high. At the same time, open interest (OI) has climbed to a record $793 million, largely driven by a recent spike in commodities trading activity.
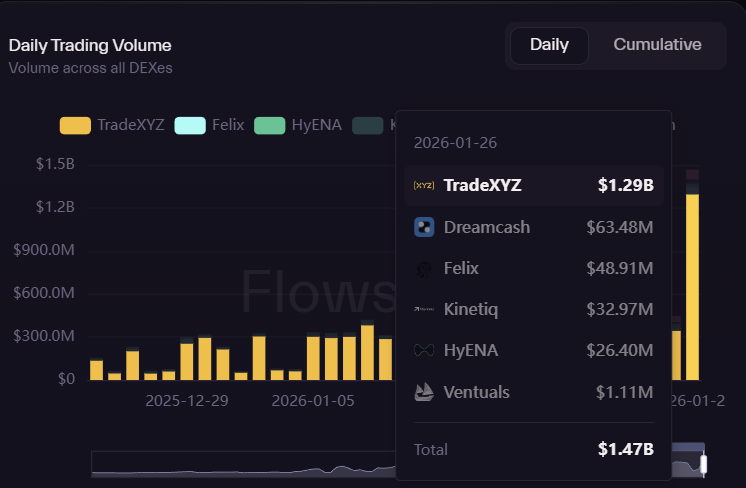
Source: flowscan
What stands out even more is the pace of growth. Just one month ago, HIP-3 open interest was sitting near $260 million. Since then, OI has been printing new weekly all-time highs, signaling rapidly increasing trader participation and capital inflows into the Hyperliquid ecosystem.
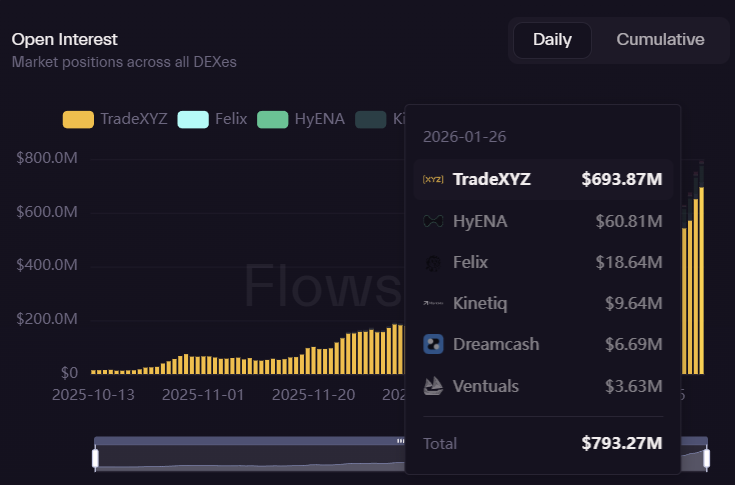
Source: flowscan
This sharp rise in volume and open interest highlights growing confidence in Hyperliquid’s on-chain derivatives infrastructure — a trend that often acts as a tailwind for the native token.
$HYPE To Rise Further?
From a technical perspective, HYPE’s daily chart is forming a Bearish Shark harmonic pattern — a structure that can appear during corrective phases but often allows for short-term bullish continuation before a larger reversal takes place.
After completing the O-X-A-B leg, HYPE managed to reclaim its 50-day moving average, an important shift in short-term momentum. The token is currently consolidating near the $23–$26 range, while facing its next major hurdle at the 100-day moving average around $31.67.
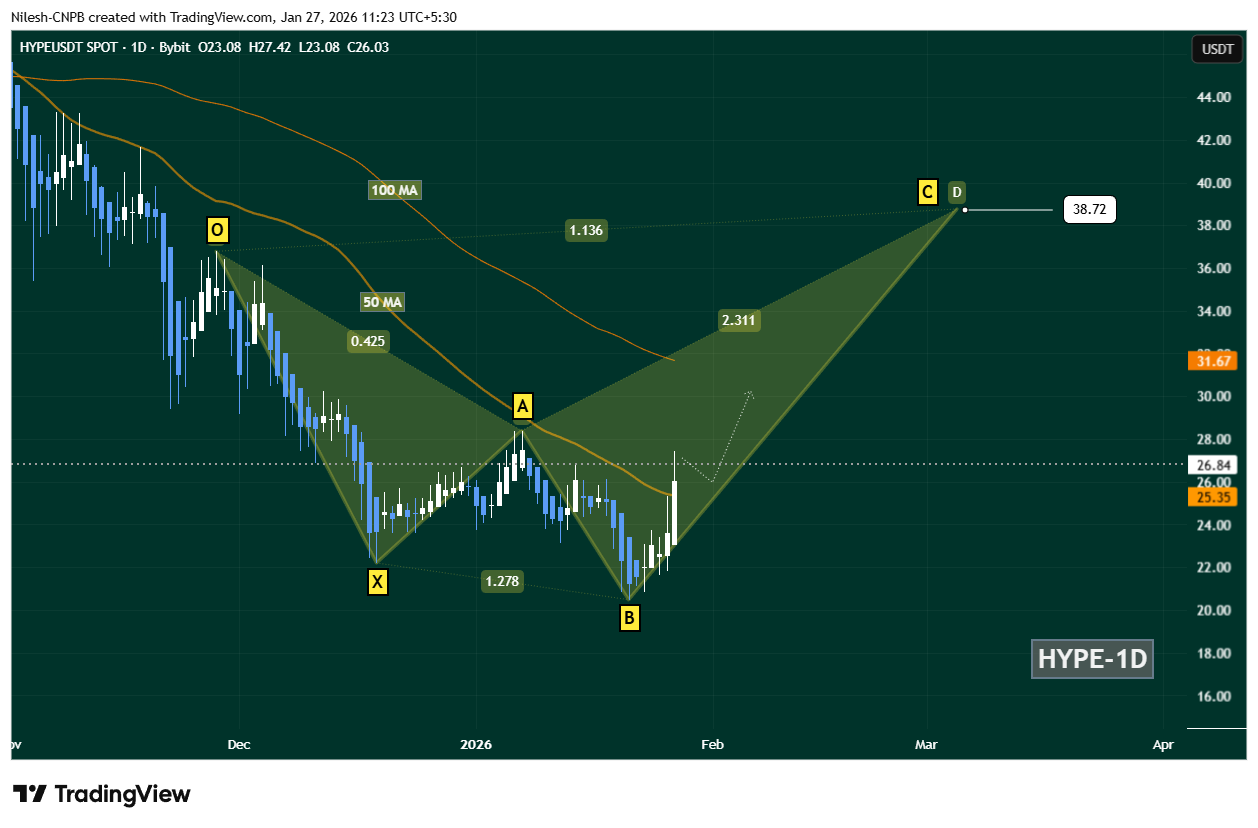
Hyperliquid (HYPE) Daily Chart/Coinsprobe (Source: Tradingview)
The key level to watch now is the 50-day MA support near $25.35. As long as HYPE holds above this zone, the bullish continuation scenario remains intact. A successful reclaim of the 100-day MA would significantly strengthen upside momentum.
If that breakout materializes, HYPE could advance toward the C-point of the Shark pattern near $38.72, which aligns with the 1.13 Fibonacci extension — a level often targeted during harmonic pattern completions.
Bottom Line
Hyperliquid’s fundamentals and technical structure are starting to align. Record-high HIP-3 trading volume, surging open interest, and renewed strength on the daily chart suggest that HYPE’s recent rally may not be a one-off move.
While resistance remains overhead near the 100-day moving average, continued support above the 50-day MA keeps the door open for further upside. If momentum holds and ecosystem growth continues at its current pace, HYPE could be positioning for another leg higher — with the $38 region emerging as a key level to watch in the weeks ahead.
Disclaimer: The views and analysis presented in this article are for informational purposes only and reflect the author’s perspective, not financial advice. Technical patterns and indicators discussed are subject to market volatility and may or may not yield the anticipated results. Investors are advised to exercise caution, conduct independent research, and make decisions aligned with their individual risk tolerance.
About Author: Nilesh Hembade is the Founder and Lead Author of Coinsprobe, with over 5 years of experience in the cryptocurrency and blockchain industry. Since launching Coinsprobe in 2023, he has been providing daily, research-driven insights through in-depth market analysis, on-chain data, and technical research.
Disclaimer: The information on this page may come from third parties and does not represent the views or opinions of Gate. The content displayed on this page is for reference only and does not constitute any financial, investment, or legal advice. Gate does not guarantee the accuracy or completeness of the information and shall not be liable for any losses arising from the use of this information. Virtual asset investments carry high risks and are subject to significant price volatility. You may lose all of your invested principal. Please fully understand the relevant risks and make prudent decisions based on your own financial situation and risk tolerance. For details, please refer to
Disclaimer.
Related Articles
Here’s why bitcoin’s drop below $68,000 raises the risk of a crash under $60,000
President Donald Trump's renewed aggressive posturing toward Iran has pushed bitcoin lower by roughly 2% over the past 24 hours to $67,000. While this price action is consistent with routine volatility, beneath the surface, market structure looks fragile.
This is mainly due to flows in the
CoinDesk17m ago
PEPE Signals Range-Bound Move as Momentum Weakens
PEPE's trading remains cautious with neutral RSI and weak MACD, indicating limited momentum and ongoing selling pressure. Oversold stochastic hints at possible short-term rebounds, but traders await confirmation before entering positions amid mixed signals.
CryptoNewsLand27m ago
SHIB Price Rises on Golden Cross and Growing Market Activity
Key Insights
The Shiba Inu price rose about five percent as an hourly golden cross and higher volume signaled renewed trader participation and short-term momentum strength.
Exchange outflows and rising liquidity suggest accumulation behavior among holders while reinforcing price stability
CryptoNewsLand32m ago
Bitcoin Hovers Near $67,000 Amid US Political Turmoil and Soaring Energy Prices
Bitcoin traded mostly flat on April 3, hovering near $67,000 despite sharp geopolitical and political developments. The cryptocurrency’s relative stability kept its market cap steady at $1.34 trillion and liquidations low at $31 million.
Political Turbulence Overshadows Conflict
Bitcoin traded
Coinpedia40m ago
Cardano Breakout Gains Momentum as Institutional Focus Shifts
Key Insights:
ADA breakout above key EMAs and Supertrend support signals renewed bullish momentum, supported by rising derivatives activity and increased market participation levels.
Institutional demand for privacy, compliance, and execution certainty drives interest in Midnight,
CryptoNewsLand42m ago
ONDO Price Stabilizes as RWA Growth and ETF Tokenization Boost Demand
Key Insights
ONDO holds above key Fibonacci support as buyers absorb selling pressure, maintaining higher lows and signaling steady demand despite broader altcoin weakness.
Partnership with Franklin Templeton expands access to tokenized ETFs, strengthening ONDO’s role in institutional real-w
CryptoNewsLand1h ago
