
Key Takeaways
-
Fartcoin (FARTCOIN) is trading near $0.33 amid a broader crypto market sell-off driven by macro uncertainty.
-
The 4H chart shows a Bullish Bat harmonic pattern, often associated with short-term trend reversals.
-
Price has reacted positively from the D-point support near $0.288, hinting at seller exhaustion.
-
A breakout above the 50-period moving average around $0.374 could confirm bullish momentum.
-
Harmonic targets point toward $0.404 and $0.476 if the pattern plays out successfully.
-
A breakdown below $0.288 would invalidate the bullish setup.
As of January 19, 2026, Fartcoin (FARTCOIN) is trading slightly lower around $0.33, moving in line with the broader crypto market pullback. The sell-off was triggered by escalating US–EU trade tensions, which sparked nearly $875 million in long liquidations and pushed major assets like Bitcoin (BTC) and Ethereum (ETH) down more than 2% over the past 24 hours.
While FARTCOIN is down over 3% at the time of writing, the price action beneath the surface tells a more interesting story. The latest chart structure is now flashing a potential bullish harmonic setup, suggesting the current dip could be more of a setup than a breakdown.
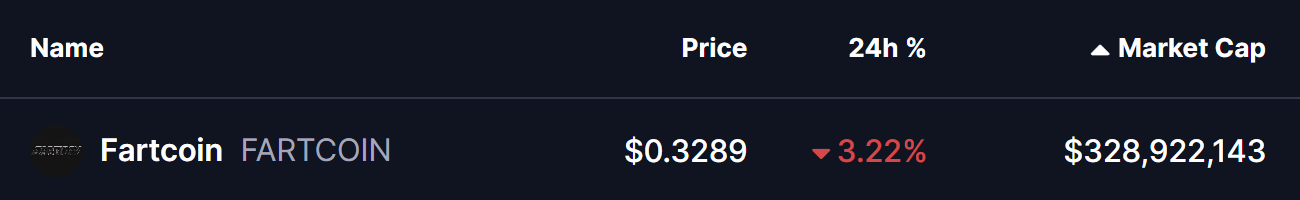
Source: Coinmarketcap
Harmonic Pattern Signals a Possible Reversal
On the 4-hour timeframe, Fartcoin is forming a well-defined Bullish Bat harmonic pattern, a structure often associated with short-term reversals after corrective phases.
The pattern began with the X point near $0.258, followed by a strong impulsive rally toward point A. Price then retraced to point B, rebounded to point C, and finally completed the structure at point D near $0.288. This D zone typically acts as the potential reversal area for the Bat pattern.
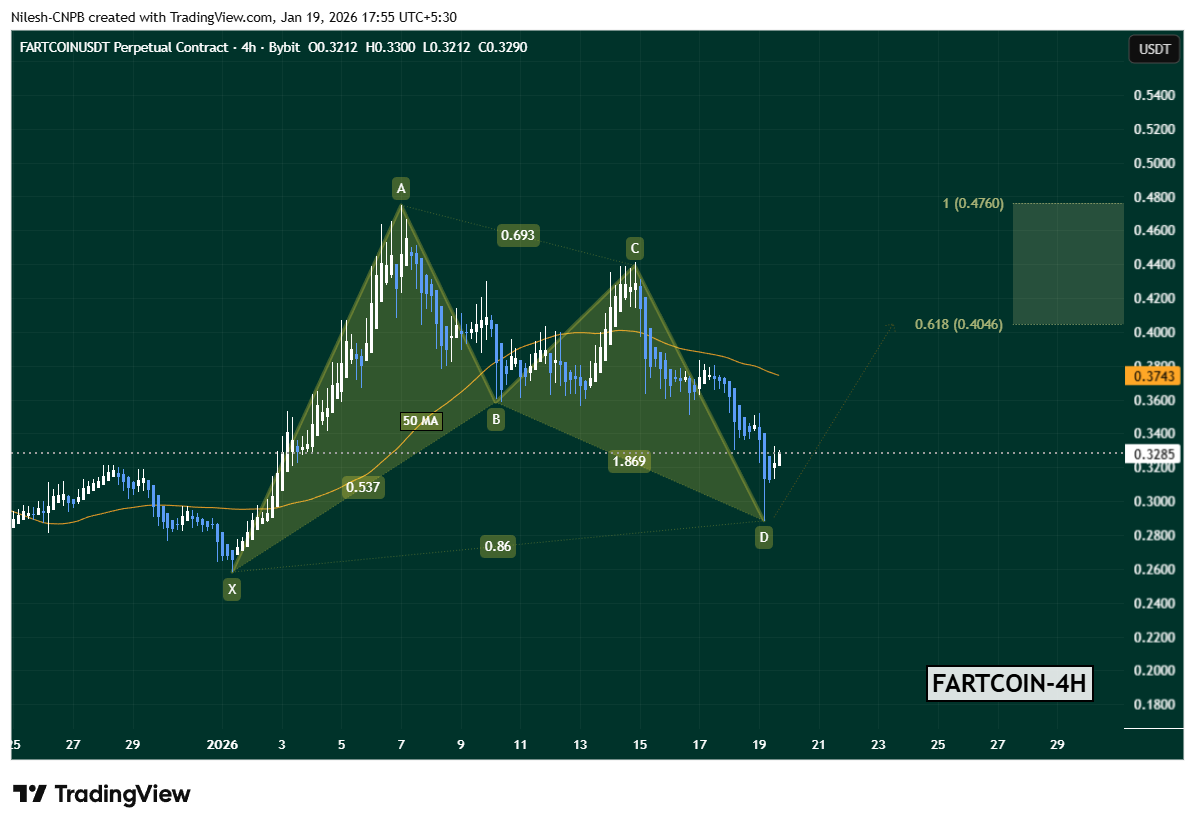
FARTCOIN Daily Chart/Coinsprobe (Source: Tradingview)
Following the completion of point D, FARTCOIN has already shown early signs of stabilization, bouncing back toward $0.3285. This initial reaction suggests that sellers may be losing momentum at current levels.
Key Levels That Could Decide the Move
One key level now in focus is the 50-period moving average, currently hovering around $0.3743. This level has acted as dynamic resistance in recent sessions and will likely determine whether the rebound gains traction or fades.
If buyers manage to push FARTCOIN above the 50 MA with improving volume, the harmonic projection opens the door for upside targets around:
This zone historically represents the area where Bat-pattern-driven moves tend to pause or face profit-taking.
On the flip side, the bullish setup remains valid only as long as price holds above the D-point support near $0.288. A decisive breakdown below this level would invalidate the harmonic structure and could expose FARTCOIN to deeper downside before any meaningful recovery attempt.
Bottom Line
Despite the ongoing market-wide weakness, Fartcoin’s chart is showing early signs of a technical rebound setup. The completion of a Bullish Bat harmonic pattern, combined with a developing bounce from key support, puts FARTCOIN at an important inflection point.
A breakout above the 50 MA could shift short-term momentum back in favor of the bulls, while failure to hold the D-point support would keep bears in control. For now, traders will be watching closely to see whether this harmonic signal translates into a sustained recovery or turns out to be another false start in a volatile market.
Disclaimer: The views and analysis presented in this article are for informational purposes only and reflect the author’s perspective, not financial advice. Technical patterns and indicators discussed are subject to market volatility and may or may not yield the anticipated results. Investors are advised to exercise caution, conduct independent research, and make decisions aligned with their individual risk tolerance.
About Author: Nilesh Hembade is the Founder and Lead Author of Coinsprobe, with over 5 years of experience in the cryptocurrency and blockchain industry. Since launching Coinsprobe in 2023, he has been providing daily, research-driven insights through in-depth market analysis, on-chain data, and technical research.
Disclaimer: The information on this page may come from third parties and does not represent the views or opinions of Gate. The content displayed on this page is for reference only and does not constitute any financial, investment, or legal advice. Gate does not guarantee the accuracy or completeness of the information and shall not be liable for any losses arising from the use of this information. Virtual asset investments carry high risks and are subject to significant price volatility. You may lose all of your invested principal. Please fully understand the relevant risks and make prudent decisions based on your own financial situation and risk tolerance. For details, please refer to
Disclaimer.
Related Articles
PENGU Eyes 30% Rally as Analyst Flags Crucial Breakout Level
PENGU consolidates near $0.009 resistance after a long 90% decline from highs.
Analysts expect a 30% rally if breakout above key resistance level confirms strength.
ETF speculation and ecosystem growth could fuel volatility and upside momentum.
Pudgy Penguins — PENGU, is sitting at a
CryptoNewsLand56m ago
Analyst: $80K Emerges as Bitcoin's Key Resistance Level, Breakout Could Trigger Increased Volatility
Gate News message, April 26 — On-chain analyst Murphy identified $80,000 as Bitcoin's primary resistance level above the current price, citing a combination of options Gamma exposure, open interest (OI), and implied volatility (IV) data. The level represents a critical checkpoint for May's price
GateNews1h ago
Crypto Fear and Greed Index Falls to 32, Indicating Panic State
Gate News message, April 26 — The Crypto Fear and Greed Index currently stands at 32, up 2 points from the previous day, according to Coinglass data. The index is in a panic state.
The seven-day average is 34, while the 30-day average is 19, indicating elevated market anxiety over the past
GateNews1h ago
PLA Plummets 47.8% in 30 Minutes, Dropping Below $0.12
Gate News message, April 26 — PLA (PlayDapp) price crashed 47.8% in just 30 minutes today, falling to $0.1225. The token, which hit a day high of $0.2347, now trades at $0.122512 with a market cap of approximately $305 million. Trading volume remains notably low, reflecting reduced investor
GateNews2h ago
7-Day AI Coin Performance Explodes — Are These 5 Tokens Worth Buying Right Now?
These tokens’ weekly performance reflects different degrees of stability, speculation, and maturity.
Social factors and interactions also contributed to short-term price dynamics.
Those with larger ecosystems appear to have more stable price movements than highly volatile assets.
There h
CryptoNewsLand7h ago
Trump delays the schedule of talks with the Middle East envoy, and Bitcoin slips modestly as geopolitical volatility eases
U.S. President Trump announced that the itinerary of the Middle East envoy, Wittekoff, and Kushner to Pakistan has been canceled, emphasizing that the U.S. side holds the negotiating initiative; Bitcoin fell in the short term due to the news, and analysts say it was due to a geopolitical risk premium, with market focus shifting to the Palm Beach crypto conference and future regulatory developments.
ChainNewsAbmedia7h ago