
Key Highlights
-
Bitcoin price is consolidating after a sharp correction from $126K, forming a clear ascending triangle on the daily chart.
-
Higher lows since December indicate steady buying pressure despite sideways price action.
-
BTC faces strong resistance in the $94,000–$95,000 zone, with the 100-day MA adding extra overhead pressure near $98K.
-
Bitcoin ETF net flows remain mixed, reflecting institutional hesitation rather than aggressive selling.
-
A confirmed breakout could open the door toward the $108,000 upside target, based on the triangle’s measured move.
**Bitcoin (BTC) **has entered a consolidation phase after its sharp pullback from October’s all-time highs near $126,000. The correction dragged price toward the $80,000 region in late November, cooling bullish momentum and placing BTC under a key resistance band just below $95,000.
While short-term price action remains choppy and weekly performance is still in the red, a closer look at the daily chart reveals a potentially constructive setup forming beneath the surface. As volatility compresses, Bitcoin appears to be coiling for its next decisive move.
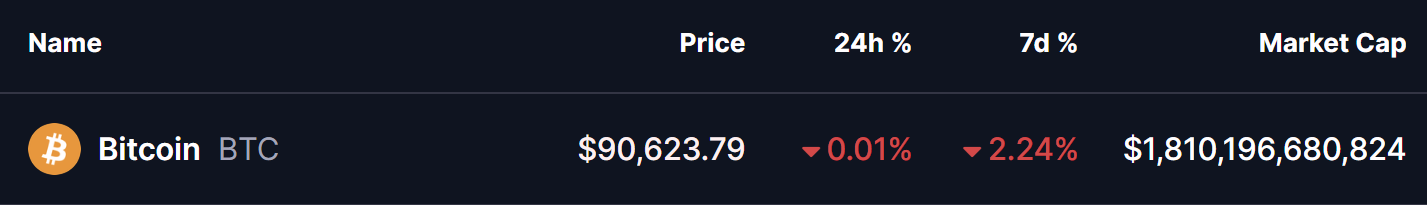
Source: Coinmarketcap
Bitcoin ETF Net Flow Signals Mixed Sentiment
According to CoinMarketCap data, Bitcoin ETF net flows over the past 30 days have remained mixed. Since mid-December, only a handful of sessions have recorded positive inflows, highlighting a lack of aggressive institutional accumulation.
This uneven flow environment reflects market indecision rather than outright weakness. Historically, such phases often coincide with consolidation periods on the chart, as larger players wait for clearer directional confirmation before committing capital.
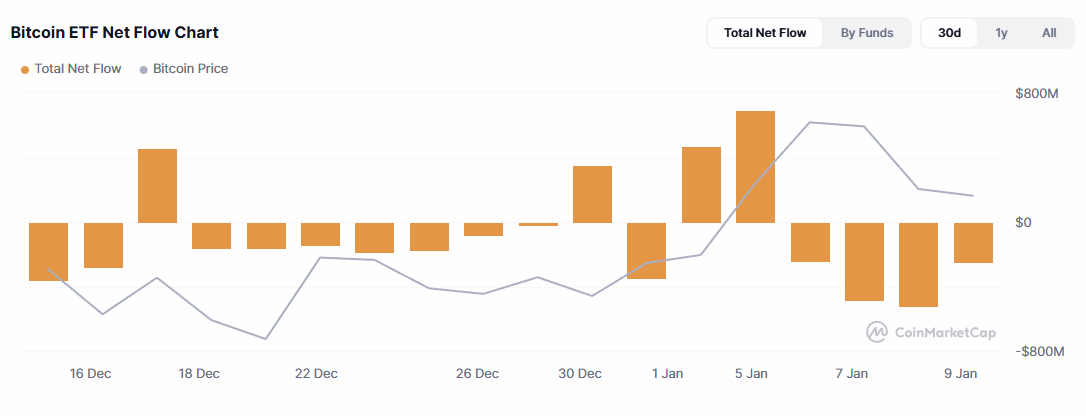
Source: Coinmarketcap
Ascending Triangle Forms on the Daily Chart
On the daily timeframe, Bitcoin is shaping a classic ascending triangle pattern, a structure typically associated with bullish continuation when confirmed.
The setup is defined by:
-
A rising trendline, supporting higher lows since early December
-
A horizontal resistance zone between $94,000 and $95,000, where repeated rejections have capped upside attempts
Each pullback toward the ascending support has been met with steady buying interest, indicating that bulls are gradually stepping in at higher price levels. This tightening price action suggests growing pressure beneath resistance.
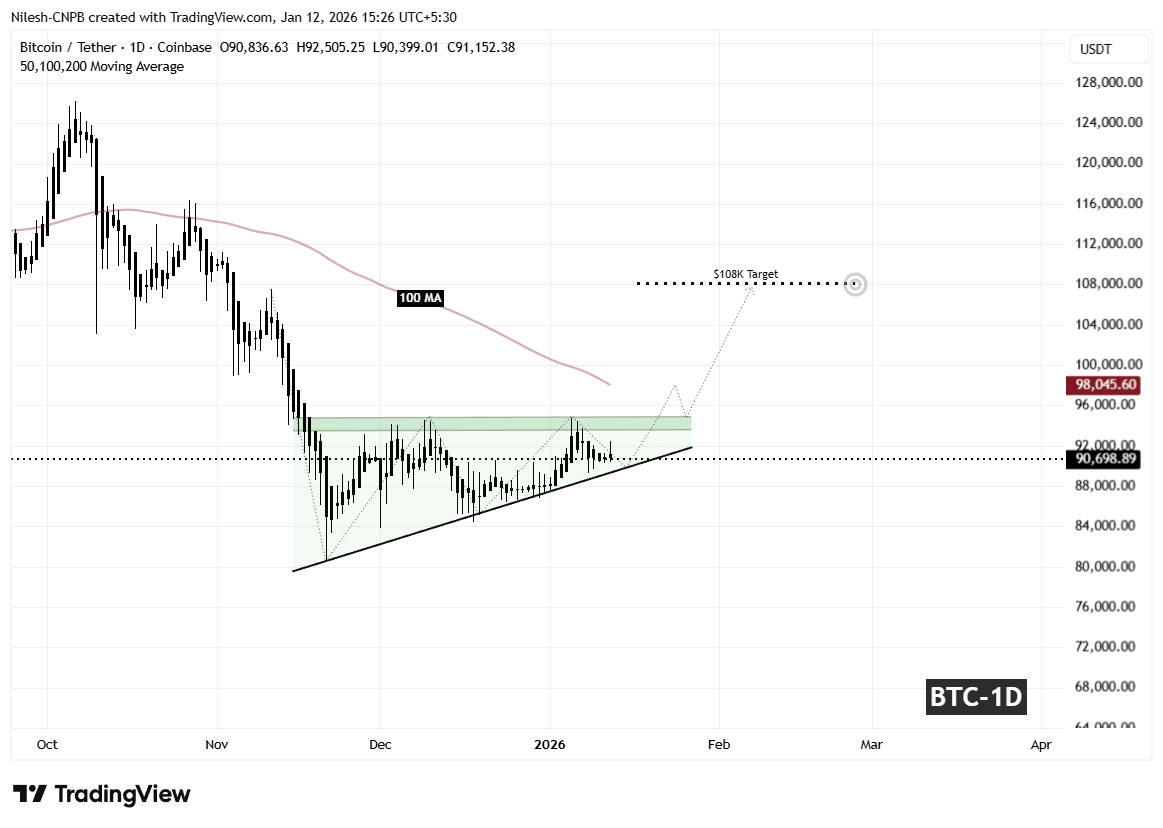
Bitcoin (BTC) Daily Chart/Coinsprobe (Source: Tradingview)
A recent rejection from the upper boundary pushed BTC briefly below $91,000, but price remains comfortably above the rising trendline. Even a controlled dip toward the $89,800–$90,000 region would keep the broader structure intact and could serve as a healthy reset before the next push higher.
What the Bitcoin (BTC) Chart Signals Next
As long as Bitcoin continues to hold above the ascending support zone near $89K–$90K, the probability of another test of the $94,000–$95,000 resistance area remains high.
However, this zone is not the only hurdle. The 100-day moving average, currently sitting near $98,045, adds an additional layer of technical resistance above the triangle. A decisive daily close above both horizontal resistance and the moving average would mark a confirmed breakout.
If that breakout occurs, the measured move projection of the ascending triangle points toward a potential upside target near $108,000. From current levels, this represents roughly 19% upside, aligning with the projected extension shown on the chart.
Until confirmation arrives, patience is key. Bitcoin remains in a compression phase, and the next major move will likely be driven by a clear resolution of this structure rather than short-term volatility.
Final Outlook
Bitcoin may appear quiet on the surface, but the daily chart suggests a market preparing for expansion. With higher lows steadily forming and resistance repeatedly tested, BTC is approaching a pivotal moment. As long as the ascending trendline holds, the broader technical bias favors a bullish resolution over deeper downside.
Frequently Asked Questions (FAQ)
What is an ascending triangle in Bitcoin price analysis?
An ascending triangle is a bullish chart pattern formed by higher lows and flat resistance, often signaling a potential upside breakout once resistance is cleared.
Is Bitcoin currently bullish or bearish?
Bitcoin is neutral-to-bullish. While price remains range-bound, the formation of higher lows suggests buyers are gradually gaining control.
What resistance level must BTC break to confirm a breakout?
BTC needs a strong daily close above the $94,000–$95,000 resistance zone to confirm a breakout from the ascending triangle.
What is Bitcoin’s upside target if the breakout occurs?
Based on the measured move of the ascending triangle, Bitcoin’s projected target is around $108,000, representing roughly 19% upside.
Do Bitcoin ETF flows impact BTC price direction?
Yes. ETF inflows often reflect institutional demand. Mixed flows indicate consolidation, while sustained inflows can support bullish momentum.
Disclaimer: The information on this page may come from third parties and does not represent the views or opinions of Gate. The content displayed on this page is for reference only and does not constitute any financial, investment, or legal advice. Gate does not guarantee the accuracy or completeness of the information and shall not be liable for any losses arising from the use of this information. Virtual asset investments carry high risks and are subject to significant price volatility. You may lose all of your invested principal. Please fully understand the relevant risks and make prudent decisions based on your own financial situation and risk tolerance. For details, please refer to
Disclaimer.
Related Articles
CTSI Price Soars 17.57%: Institutional Interest Ramps Up
Amid a crypto market downturn, CTSI surged 17.57% to $0.03626 in an hour, driven by high trading volume and institutional interest in altcoins. Traders are now watching key support and resistance levels for future price movements.
Coinfomania58m ago
Bitcoin falls below 71,500 USD, U.S.-Iran talks remain deadlocked, and the Strait of Hormuz becomes the biggest point of contention
On April 11, the U.S. and Iran began 20 hours of negotiations in Pakistan. The core issue was freedom of passage through the Strait of Hormuz. After Bitcoin briefly rose to $73,800, it quickly fell back to $71,557. The U.S. side took a hardline stance, demanding that Iran open the strait, while Iran insisted that easing restrictions must wait until a comprehensive agreement is reached. The two sides have not yet reached a consensus.
動區BlockTempo5h ago
Crypto Market Maintains Steady Growth Trajectory As Top Assets Show Gains
The crypto market continues to grow, with a market cap of $2.44T and Bitcoin and Ethereum showing slight increases. Top gainers include $GPM and $BASE. Meanwhile, DeFi TVL declined, NFT sales rose, and notable developments include a trader's significant loss and a push for regulatory clarity in Congress.
BlockChainReporter6h ago
BTC 15-minute chart slightly down 0.57%: leveraged long positions passively cut risk and macro sentiment disturbances drive volatility
2026-04-12 12:45 to 13:00 (UTC), the BTC price range was 71081.7 to 71493.2 USDT, with an amplitude of 0.58%. Within 15 minutes, the return recorded was -0.57%. During the period of unusual activity, market volatility increased somewhat, risk sentiment warmed up, and overall attention rose; however, there was no extreme surge in volume or a sudden drop in liquidity.
The main driver behind this unusual activity is that, under the leverage structure, long positions were reduced passively. Recently, the funding rate for perpetual contracts turned from negative to positive. Leverage among longs in the market accumulated; the price dipped slightly, triggering liquidations of some leveraged long positions and sell orders for position closures, resulting in
GateNews8h ago
Analyst: Bitcoin’s current pullback is relatively mild compared with past ones, but the bottom has not been confirmed yet.
Crypto analyst Axel Adler Jr said the current Bitcoin pullback is smaller than historic bearish-market levels, but a bottom has not yet been confirmed. He believes the market is still in a mild bear phase, and that a true recovery will require patience and waiting.
GateNews9h ago
Bitcoin long-term holdings increased to 12.4 million coins, and the 30-day change has remained positive.
CryptoQuant analyst Darkfost says the Bitcoin market is entering an early stabilization phase, with stronger long-term holding behavior. The amount of BTC held for more than a year has increased, and investors are more inclined to hold than to distribute. This suggests the market is transitioning toward long-term conviction; the current trend is viewed as an early stability signal, but it needs longer-term confirmation.
GateNews11h ago
