
**Date: **Wed, Jan 07, 2026 | 06:20 AM GMT
The broader cryptocurrency market continues to show strong New Year momentum, with Bitcoin (BTC) up around 4% and Ethereum (ETH) gaining over 9% on a weekly basis. This improving sentiment is gradually spilling over into major altcoins — including the DePIN-focused token Akash Network (AKT).
AKT has already posted an impressive 20% weekly gain. While this short-term strength has caught traders’ attention, the more important development is unfolding on the higher-timeframe chart. Recent price action suggests a meaningful shift in market structure, hinting that AKT may be transitioning out of a prolonged corrective phase and into the early stages of a bullish continuation.
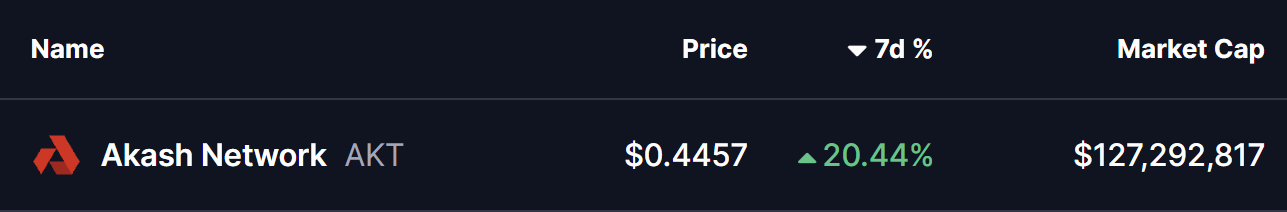
Source: Coinmarketcap
Falling Wedge and Rounding Bottom in Play
On the daily chart, AKT has been trading within a broader falling wedge — a structure that often precedes bullish reversals as selling pressure gradually weakens. Within this larger wedge, price action is also shaping a developing rounding bottom pattern, reflecting steady accumulation and seller exhaustion.
The formation began after AKT faced strong rejection near the $0.5441 resistance zone in late November. That rejection triggered a sharp sell-off, pushing price lower toward the $0.3465 region. However, bears failed to extend losses beyond this area. Instead, demand stepped in, downside momentum slowed, and price began to stabilize.
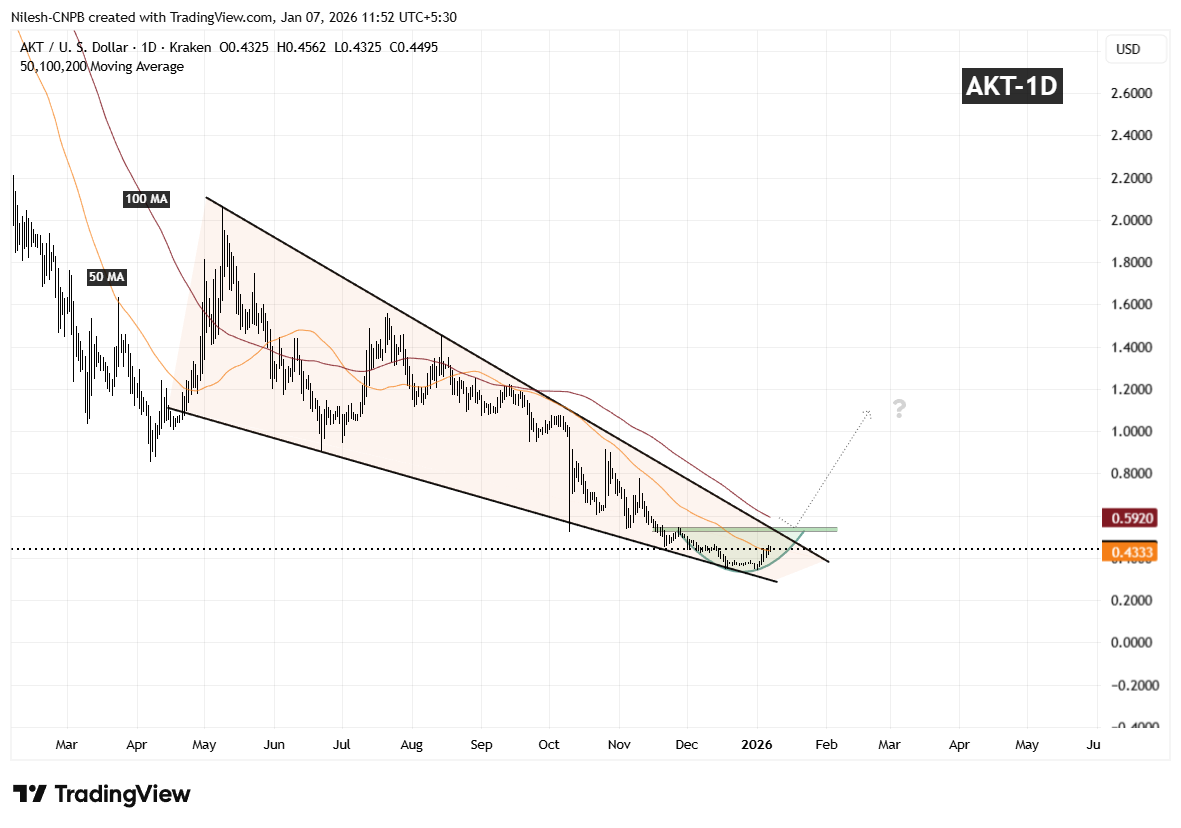
Akash Network (AKT) Daily Chart/Coinsprobe (Source: Tradingview)
Over the following weeks, volatility compressed and AKT started to curl higher in a smooth, rounded fashion — closely matching the textbook behavior of a rounding bottom. Importantly, the recent rebound has pushed price back above the 50-day moving average around $0.4333, a level that had previously acted as resistance and is now beginning to flip into support.
What’s Next for AKT?
If AKT can continue to hold above the 50-day moving average, this area may act as a solid base for further upside attempts. From here, attention shifts toward the descending resistance trendline of the falling wedge, which aligns closely with the $0.5441 resistance zone.
A clean and decisive breakout above this confluence area, followed by sustained acceptance, would confirm a broader bullish expansion phase and mark a clear trend reversal from the prior downtrend. Such a move would likely attract renewed momentum participation as the market recognizes the structural shift.
Until that breakout occurs, the pattern remains in development. Short-term consolidation or shallow pullbacks are still possible as price digests recent gains. However, as long as AKT continues to print higher lows above the established base, the broader technical structure remains constructive.
Overall, the chart suggests AKT is approaching a critical inflection point — one that could determine whether this recovery evolves into a sustained bullish trend as 2026 progresses.
Disclaimer: The views and analysis presented in this article are for informational purposes only and reflect the author’s perspective, not financial advice. Technical patterns and indicators discussed are subject to market volatility and may or may not yield the anticipated results. Investors are advised to exercise caution, conduct independent research, and make decisions aligned with their individual risk tolerance.
About Author: Nilesh Hembade is the Founder and Lead Author of Coinsprobe, with over 5 years of experience in the cryptocurrency and blockchain industry. Since launching Coinsprobe in 2023, he has been providing daily, research-driven insights through in-depth market analysis, on-chain data, and technical research.
Disclaimer: The information on this page may come from third parties and does not represent the views or opinions of Gate. The content displayed on this page is for reference only and does not constitute any financial, investment, or legal advice. Gate does not guarantee the accuracy or completeness of the information and shall not be liable for any losses arising from the use of this information. Virtual asset investments carry high risks and are subject to significant price volatility. You may lose all of your invested principal. Please fully understand the relevant risks and make prudent decisions based on your own financial situation and risk tolerance. For details, please refer to
Disclaimer.
Related Articles
Chainlink Price Compresses Below $10 as Breakout Pressure Builds
Key Insights
Chainlink maintains higher lows within a tightening range, reflecting steady accumulation as buyers absorb selling pressure and prepare for a potential breakout move
Repeated resistance tests near $10 weaken supply levels while rising support strengthens demand, increasing the p
CryptoNewsLand9m ago
XRP Consolidation Signals Reset as Bullish Setup Emerges
XRP has recently rebounded to $1.39 after trading between $1.20 and $1.40 due to improved market sentiment. A significant drop in futures open interest reflects reduced speculation, while technical indicators suggest a potential bullish breakout, targeting $1.50 and possibly $1.80.
CryptoNewsLand1h ago
Cardano Tests $0.243 Pivot as Breakout Pressure Builds
Key Insights
Cardano trades near a historically strong pivot level at $0.243 while a descending wedge apex forms, increasing the likelihood of a major breakout soon.
A confirmed breakout requires a daily close above $0.2450 and SAR resistance, which could shift momentum toward $0.537 as the
CryptoNewsLand2h ago
Elon Musk References Fuel Trading Surge in 'Asteroid' Crypto Token
Elon Musk's online activity revived interest in a cryptocurrency token known as "Asteroid crypto," causing increased trading and volatility on decentralized exchanges. Market reactions were driven by social media references, illustrating the token's sensitivity to influencer attention.
GateNews3h ago
BTC rises 0.69% over 15 minutes: spot buy-side strength and sustained whale accumulation on-chain reinforce the move
From 14:30 to 14:45 (UTC) on 2026-04-17, the Bitcoin (BTC) market saw clear signs of abnormal movement. The 15-minute candlestick return reached +0.69%, with the price ranging from 77455.4 to 78044.4 USDT and an amplitude of 0.76%. Short-term fluctuations increased market attention, trading volume expanded in parallel, and liquidity improved further.
The main driver behind this abnormal move was a clear strengthening of spot-market buy-side demand. According to on-chain and statistical data, from 14:00 to 15:00, BTC spot buys had the upper hand. Massive buy orders continued to push the price higher, while whale addresses (≥10,000 BTC holdings) were actively net-buying during this period. The inflow of large on-chain funds directly drove spot prices higher. In addition, CME Bitcoin futures open interest increased by 70%, yet there was no large-scale liquidation or forced selling, indicating that institutional capital was returning in an orderly manner and that futures leverage did not become the dominant source of pressure. The leading force behind this upswing came from the spot market, and any wait-and-see sentiment caused by shrinking ETF flows did not suppress short-term prices.
Meanwhile, on-chain data shows that network activity has continued to rise, and the distribution of holdings is becoming more concentrated. In the short term, the coordinated effect of whales and newly onboarded users amplified price elasticity. Benefiting from an increase in macro risk appetite in mid-April—along with dovish signals from the Bank of Japan coinciding with easing geopolitical tensions—BTC’s attractiveness as a risk asset improved, and investors’ risk appetite strengthened. In addition, although ETF net inflows fell to $4.2 million, there were no large outflows, providing bottom support for spot. Multiple factors converged to drive BTC’s short-term rebound within the 15-minute window.
It is worth noting that the SOPR data for short-term holders shows that some short-term capital is currently trading at a loss; if the price pulls back, there may be a risk of additional downside. Changes in institutional capital driven by shrinking ETF flows are also a potential trigger for volatility. The return of leveraged funds to the futures market is also worth watching. Investors should closely monitor key support levels, the movements of actively circulating on-chain funds, and changes in macro news, so they can grasp the market’s timing and stay up to date with more real-time market information.
GateNews3h ago
