
**Date: **Tue, Jan 06, 2026 | 11:20 AM GMT
The broader cryptocurrency market continues to show renewed strength as 2026 gets underway. Bitcoin (BTC) is up around 6% on the week, while Ethereum (ETH) has posted gains of over 8%, helping improve overall sentiment across the market. This positive momentum is now spreading into major altcoins — including** Algorand (ALGO).**
ALGO has already delivered a strong 22% weekly gain, but the more important development is unfolding beneath the surface. Recent price action suggests a clear structural shift is taking place, one that could mark the early stages of a sustained bullish continuation if a critical resistance zone is decisively cleared.
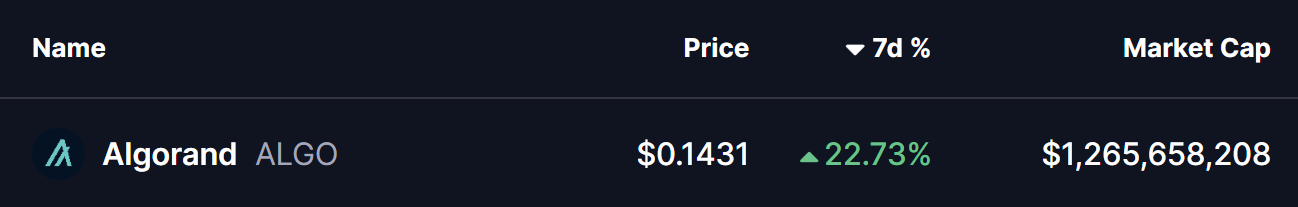
Source: Coinmarketcap
Right-Angled Descending Broadening Pattern in Play
On the 4-hour timeframe, ALGO had been trading inside a right-angled descending broadening formation — a bullish reversal structure defined by a flat overhead resistance and a rising lower boundary. For several weeks, price struggled to overcome the $0.1340–$0.1486 resistance band, with each rejection keeping ALGO locked in consolidation.
The recent rebound from the lower boundary of the structure marked a key turning point. Buyers stepped in aggressively, allowing ALGO to reclaim the 200-period moving average around $0.1225 — a level that had previously acted as dynamic resistance. This reclaim signaled improving momentum and a shift in short-term trend control.
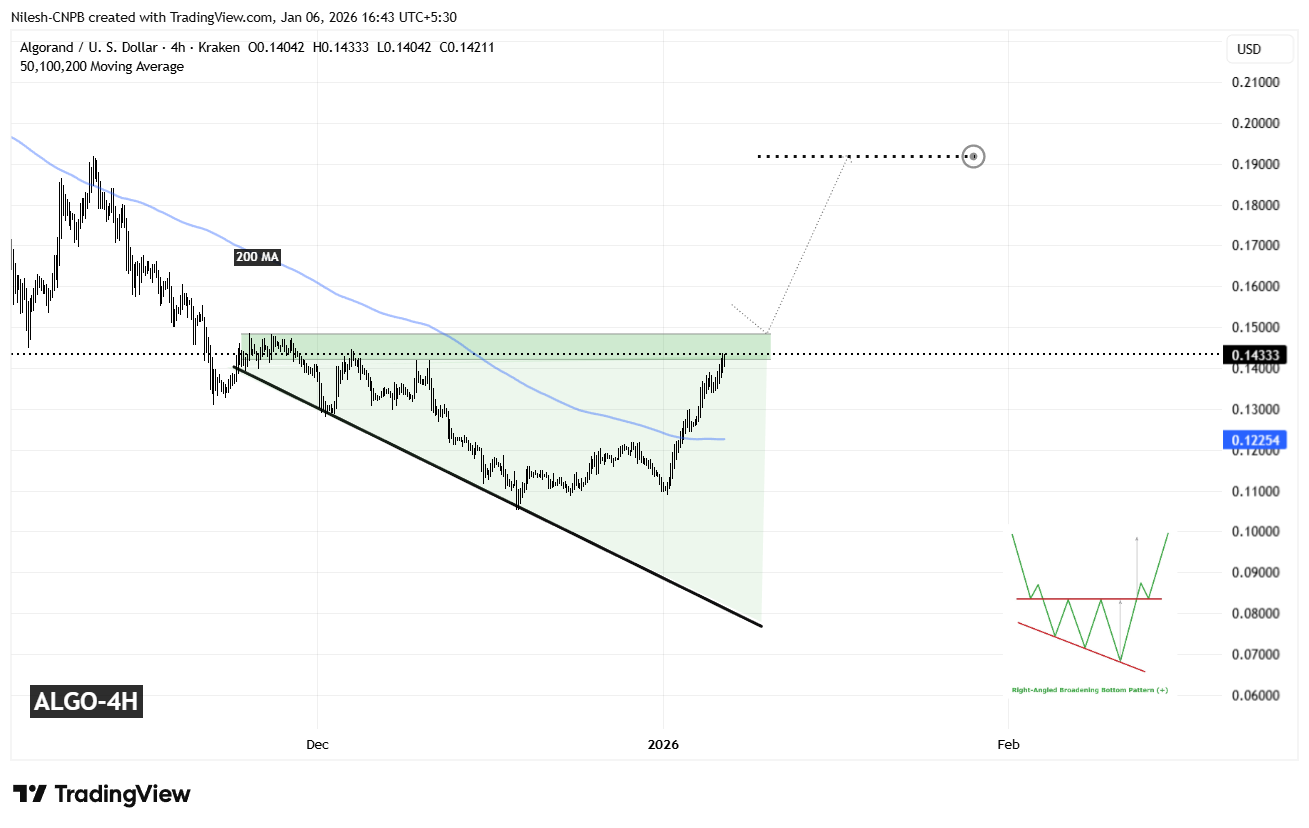
Algorand (ALGO) 4H Chart/Coinsprobe (Source: Tradingview)
Since then, ALGO has continued to push higher and is now pressing back into the same resistance zone that capped upside attempts in the past. This return to resistance places price at a critical inflection point where the broader trend direction could soon be decided.
What’s Next for ALGO?
A decisive close above the $0.1340–$0.1486 resistance zone would confirm a breakout from the descending broadening structure and validate the broader bullish reversal setup. Acceptance above this zone could attract fresh momentum participation and open the door to a stronger expansion phase.
Based on the depth of the formation and the projected measured move, the upside target points toward the $0.1920 region. Reaching that level would imply a potential upside of roughly 33% from current prices, aligning well with the typical behavior seen following successful breakouts from this pattern.
That said, patience remains important. Before any confirmed breakout, ALGO could still see short-term pullbacks — including a retest of the 200-period moving average, which has now turned into dynamic support. Such pullbacks would not invalidate the bullish setup as long as price continues to hold higher-low structures.
Until a clear breakout and follow-through occur, traders may want to remain cautious and avoid chasing price. The $0.1340–$0.1486 zone remains the key decision area that will determine whether Algorand transitions into a sustained bullish phase or continues consolidating as the new year unfolds.
Disclaimer: The views and analysis presented in this article are for informational purposes only and reflect the author’s perspective, not financial advice. Technical patterns and indicators discussed are subject to market volatility and may or may not yield the anticipated results. Investors are advised to exercise caution, conduct independent research, and make decisions aligned with their individual risk tolerance.
About Author: Nilesh Hembade is the Founder and Lead Author of Coinsprobe, with over 5 years of experience in the cryptocurrency and blockchain industry. Since launching Coinsprobe in 2023, he has been providing daily, research-driven insights through in-depth market analysis, on-chain data, and technical research.
Disclaimer: The information on this page may come from third parties and does not represent the views or opinions of Gate. The content displayed on this page is for reference only and does not constitute any financial, investment, or legal advice. Gate does not guarantee the accuracy or completeness of the information and shall not be liable for any losses arising from the use of this information. Virtual asset investments carry high risks and are subject to significant price volatility. You may lose all of your invested principal. Please fully understand the relevant risks and make prudent decisions based on your own financial situation and risk tolerance. For details, please refer to
Disclaimer.
Related Articles
PEPE Consolidates Above $0.05324 Support as Momentum Strengthens and Resistance Near $0.05336 Holds
PEPE has a tight intraday price compression with a support level of $0.053243 and resistance level of $0.053363.
A RSI of 64.13 represents the moderate bullish momentum whereas MACD history is slightly positive, which indicates the gradual buying momentum.
The price is at $0.053364
CryptoNewsLand34m ago
HYPE Hits $35.53 After 2.4% Jump — Will Momentum Hold as Price Tests $35.59 Resistance?
Hyperliquid’s HYPE trades at $35.53, approaching the $35.59 resistance after a 2.4% daily gain.
The chart shows the $33.67 zone acting as support after price moved above a previously contested level.
Price now trades between $33.67 support and $35.59 resistance, shaping the immediate
CryptoNewsLand39m ago
Cardano áp sát mốc 0,28 USD khi lực mua nhỏ lẻ tăng mạnh – Đà bứt phá đã cận kề?
The current price of Cardano (ADA) is around $0.270, having risen from a support level of $0.254-$0.260. It underwent a dip to $0.2194 before buyers returned, leading to a structure indicating accumulation. The price tests resistance at $0.287, while whale activity raises market uncertainty. Despite a reduction in ADA holdings among large wallets, the supply remains concentrated in their hands, suggesting strategic liquidity reallocation rather than widespread selling. Meanwhile, retail investors continue accumulating ADA.
TapChiBitcoin3h ago
Bitcoin MVRV Z-Score Drops Below 1 Again
The MVRV Z-Score is a key on-chain indicator for assessing Bitcoin's value by comparing market and realized capitalizations. Historical data shows that when the score drops below 1, it often signals significant market recovery. However, changing market dynamics and institutional influences may alter future patterns.
Coinfomania3h ago
「刻舟求劍」式幣價預測走紅,玄學預言的實戰邏輯與缺陷
作者:Frank,PANews
每當市場進入不上不下的迷惘階段,就會有人試圖用「刻舟求劍」式的歷史回溯方法去預測下一段走勢。在這種情況下,人們往往能從這些理論和圖表中看到歷史總是在重演,並似乎自動將未來一段時間的行情走勢與過去的某一段進行重疊驗證。
這種重合似乎有著神奇的效果,也常常被驗證。有部落客自稱這種預測的準確率能到達 75%~80% 。
這種在社群媒體上屢屢爆紅的「刻舟求劍」式價格預測,究竟是在幫助市場識別階段,還是在把噪音包裝成預言?
從「滴答分形」到「歷史押韻」
關於 2025 年 10 月市場頂點預測的巔峰操作是名為 CryptoBullet 的分析師,他所創建的一種名為「ti
区块客4h ago
Dogecoin (DOGE) Prints Abnormal $0 as Short Sellers Disappear - U.Today
Dogecoin's recent rally saw $0 in short liquidations, indicating traders were betting long. Despite a 4.61% decline due to market pullback, volume remained high. The potential for DOGE to reach $0.10 depends on Bitcoin's recovery.
UToday4h ago