
The broader cryptocurrency market has been experiencing choppy price action over the past several weeks, a phase that began after the sharp sell-off on October 10. That correction dragged Ethereum (ETH) down by nearly 22% over the last 60 days, keeping pressure firmly on major altcoins — including **Avalanche (AVAX).**
AVAX has slipped more than 12% over the past week alone, extending its 60-day decline to over 41%. While the short-term trend remains weak, a closer look at the higher-timeframe chart suggests that the sell-off may be approaching an area where downside momentum starts to fade.
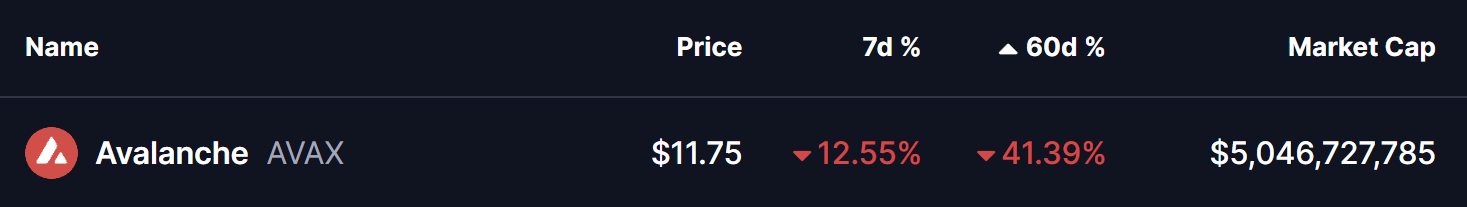
Source: Coinmarketcap
Falling Wedge Pattern in Play
On the weekly chart, AVAX continues to trade inside a well-defined falling wedge pattern. This structure has been guiding price action since early 2024 and is characterized by lower highs and lower lows that gradually compress into a narrowing range. Historically, falling wedges often reflect slowing selling pressure rather than aggressive distribution.
As shown on the chart, the latest decline has pushed AVAX directly into the lower boundary of this wedge, near the $11.64 region. This zone has acted as a critical demand area in the past, repeatedly attracting buyers and triggering short-term rebounds. Once again, price is reacting near this level, suggesting that sellers may be losing strength as AVAX presses into long-term support.
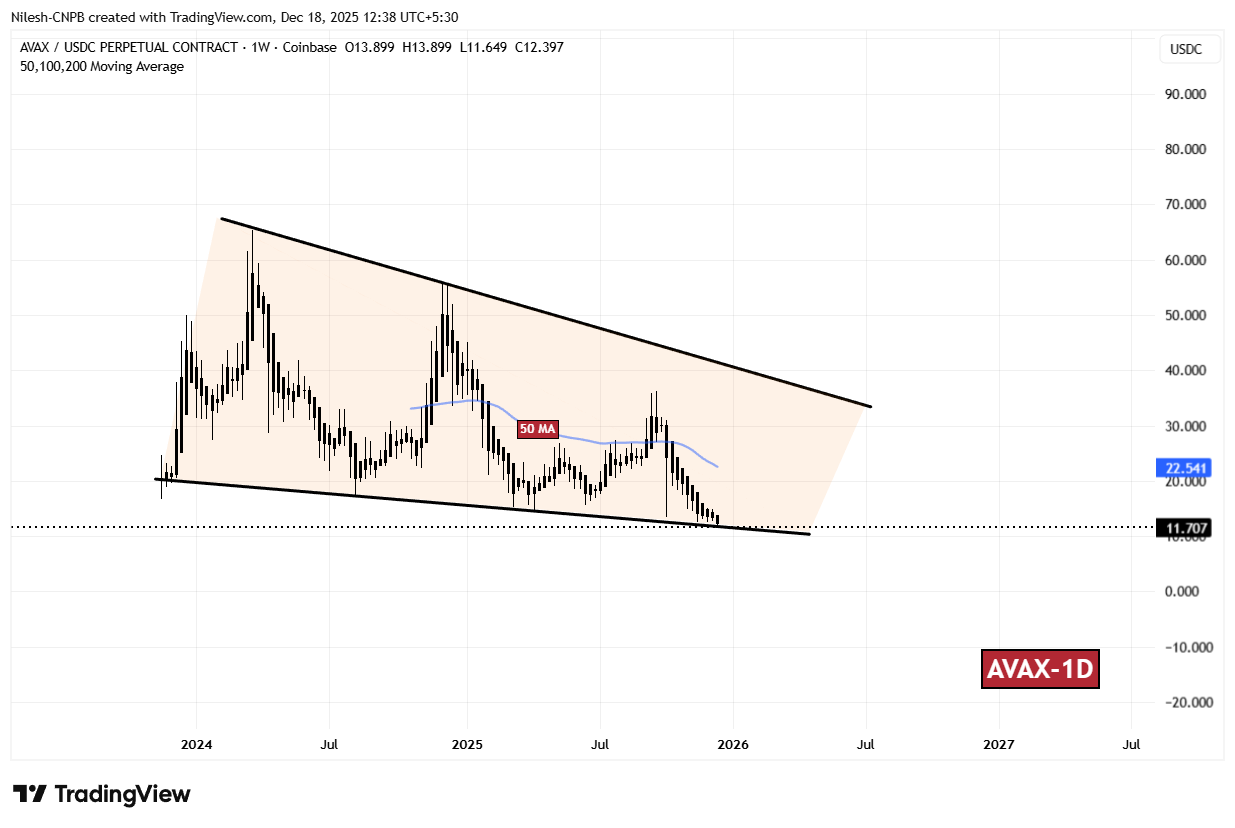
AVAX Weekly Chart/Coinsprobe (Source: Tradingview)
The repeated defenses of the wedge’s lower trendline, combined with shrinking downside follow-through, point to growing indecision rather than panic selling. This behavior often precedes a stabilization phase or a relief bounce.
What’s Next for AVAX?
If AVAX continues to hold above the wedge floor, the focus will shift to whether buyers can reclaim key overhead levels. The first major hurdle sits at the 50-week moving average, currently near $22.54. This level has consistently acted as dynamic resistance during prior recovery attempts and remains a key marker for any trend change.
A sustained move above this moving average would strengthen the bullish case and potentially open the door for a push toward the upper boundary of the falling wedge. Reaching that zone would signal a meaningful shift in market structure and sentiment.
That said, the setup remains conditional. A decisive weekly close below the wedge’s lower boundary would invalidate the pattern and expose AVAX to further downside risk, with the next notable support area emerging near the $9.00 level.
For now, AVAX sits at a technically important crossroads. While broader market conditions remain fragile, the compression within this falling wedge suggests that a larger move may be approaching — with the coming weeks likely to determine whether this support zone becomes a base for recovery or a stepping stone to deeper losses.
Disclaimer: The views and analysis presented in this article are for informational purposes only and reflect the author’s perspective, not financial advice. Technical patterns and indicators discussed are subject to market volatility and may or may not yield the anticipated results. Investors are advised to exercise caution, conduct independent research, and make decisions aligned with their individual risk tolerance.
Disclaimer: The information on this page may come from third parties and does not represent the views or opinions of Gate. The content displayed on this page is for reference only and does not constitute any financial, investment, or legal advice. Gate does not guarantee the accuracy or completeness of the information and shall not be liable for any losses arising from the use of this information. Virtual asset investments carry high risks and are subject to significant price volatility. You may lose all of your invested principal. Please fully understand the relevant risks and make prudent decisions based on your own financial situation and risk tolerance. For details, please refer to
Disclaimer.
Related Articles
Cardano Tests $0.243 Pivot as Breakout Pressure Builds
Key Insights
Cardano trades near a historically strong pivot level at $0.243 while a descending wedge apex forms, increasing the likelihood of a major breakout soon.
A confirmed breakout requires a daily close above $0.2450 and SAR resistance, which could shift momentum toward $0.537 as the
CryptoNewsLand39m ago
Elon Musk References Fuel Trading Surge in 'Asteroid' Crypto Token
Elon Musk's online activity revived interest in a cryptocurrency token known as "Asteroid crypto," causing increased trading and volatility on decentralized exchanges. Market reactions were driven by social media references, illustrating the token's sensitivity to influencer attention.
GateNews1h ago
BTC rises 0.69% over 15 minutes: spot buy-side strength and sustained whale accumulation on-chain reinforce the move
From 14:30 to 14:45 (UTC) on 2026-04-17, the Bitcoin (BTC) market saw clear signs of abnormal movement. The 15-minute candlestick return reached +0.69%, with the price ranging from 77455.4 to 78044.4 USDT and an amplitude of 0.76%. Short-term fluctuations increased market attention, trading volume expanded in parallel, and liquidity improved further.
The main driver behind this abnormal move was a clear strengthening of spot-market buy-side demand. According to on-chain and statistical data, from 14:00 to 15:00, BTC spot buys had the upper hand. Massive buy orders continued to push the price higher, while whale addresses (≥10,000 BTC holdings) were actively net-buying during this period. The inflow of large on-chain funds directly drove spot prices higher. In addition, CME Bitcoin futures open interest increased by 70%, yet there was no large-scale liquidation or forced selling, indicating that institutional capital was returning in an orderly manner and that futures leverage did not become the dominant source of pressure. The leading force behind this upswing came from the spot market, and any wait-and-see sentiment caused by shrinking ETF flows did not suppress short-term prices.
Meanwhile, on-chain data shows that network activity has continued to rise, and the distribution of holdings is becoming more concentrated. In the short term, the coordinated effect of whales and newly onboarded users amplified price elasticity. Benefiting from an increase in macro risk appetite in mid-April—along with dovish signals from the Bank of Japan coinciding with easing geopolitical tensions—BTC’s attractiveness as a risk asset improved, and investors’ risk appetite strengthened. In addition, although ETF net inflows fell to $4.2 million, there were no large outflows, providing bottom support for spot. Multiple factors converged to drive BTC’s short-term rebound within the 15-minute window.
It is worth noting that the SOPR data for short-term holders shows that some short-term capital is currently trading at a loss; if the price pulls back, there may be a risk of additional downside. Changes in institutional capital driven by shrinking ETF flows are also a potential trigger for volatility. The return of leveraged funds to the futures market is also worth watching. Investors should closely monitor key support levels, the movements of actively circulating on-chain funds, and changes in macro news, so they can grasp the market’s timing and stay up to date with more real-time market information.
GateNews2h ago
ADA Tests Key $0.230 Support While Upgrade Timeline Holds
Key Insights:
ADA trades at the wedge apex near $0.2387 as price compresses between $0.230 support and $0.245 resistance ahead of a decisive breakout move.
Protocol 11’s timeline remains intact despite the memory bug fix, keeping Cardano fundamentals stable while macro risks dominate short-t
CryptoNewsLand2h ago
