Date: Sun, Dec 21 2025 | 08:56 AM GMT
The broader cryptocurrency market has remained under pressure over the past several weeks, following the sharp sell-off that began on October 10. That corrective phase dragged Ethereum (ETH) down by nearly 23% over the last 60 days and weighed heavily on overall market sentiment. While many altcoins have struggled to stabilize, Quant (QNT) has shown relative resilience, posting only a modest decline and holding above a historically important support zone.
From a technical perspective, the daily chart suggests that QNT may be approaching a critical decision point, with price action forming a recognizable structure that could influence its next directional move.
Source: Coinmarketcap
Head and Shoulders Pattern Takes Shape
On the daily timeframe, QNT appears to be carving out a head and shoulders formation, a well-known pattern that often signals a potential trend shift once the neckline is tested. Earlier in the structure, QNT formed the left shoulder before rallying sharply to its head near the $100 region. From there, price reversed lower and slid back toward the neckline, located around the $70 support zone.
This $70 area has proven to be a strong demand zone in the past, repeatedly attracting buyers and preventing deeper declines. The recent move into this region was met with a noticeable reaction, as reflected by the long lower wick on the chart. That rejection from support pushed price back toward the $78 level, suggesting that buyers are actively defending the neckline and potentially forming the right shoulder of the pattern.
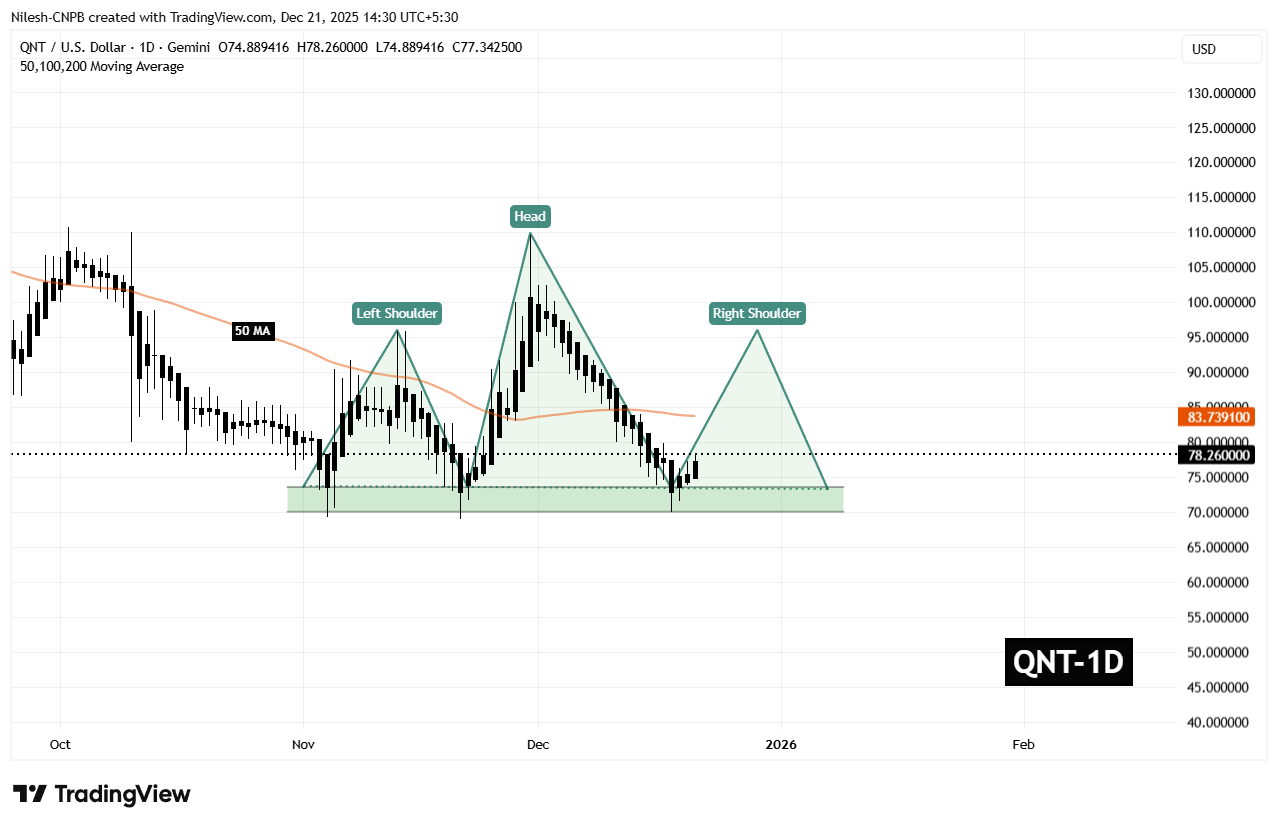
Quant (QNT) Daily Chart/Coinsprobe (Source: Tradingview)
The behavior around this zone is critical. A successful defense of the neckline often opens the door for a relief rally, especially if broader market conditions stabilize.
What’s Next for QNT?
For bullish momentum to build, QNT needs to reclaim the 50-day moving average, currently sitting near $83.73. This level now acts as a key short-term resistance, and a daily close above it would signal a shift in momentum back in favor of buyers.
If that recovery unfolds, the chart points toward a potential move into the $95.90 region. Such a move would represent a rebound of roughly 22% from current levels and align with the typical reaction seen during the right-shoulder phase of this pattern. A rally of this nature would not only ease recent selling pressure but also place QNT back into a more neutral technical posture.
That said, the setup remains delicate. If the $70 neckline support fails to hold on a sustained basis, the head and shoulders structure would remain bearish, opening the door to further downside and extending the corrective phase. For now, all eyes remain on how price behaves around this key support and whether buyers can regain control above the moving average.
Disclaimer: The views and analysis presented in this article are for informational purposes only and reflect the author’s perspective, not financial advice. Technical patterns and indicators discussed are subject to market volatility and may or may not yield the anticipated results. Investors are advised to exercise caution, conduct independent research, and make decisions aligned with their individual risk tolerance.
Disclaimer: The information on this page may come from third parties and does not represent the views or opinions of Gate. The content displayed on this page is for reference only and does not constitute any financial, investment, or legal advice. Gate does not guarantee the accuracy or completeness of the information and shall not be liable for any losses arising from the use of this information. Virtual asset investments carry high risks and are subject to significant price volatility. You may lose all of your invested principal. Please fully understand the relevant risks and make prudent decisions based on your own financial situation and risk tolerance. For details, please refer to
Disclaimer.
Related Articles
Algorand price surges 23%, triggering a crypto market frenzy as Google's AI whitepaper integrates with Revolut
Algorand (ALGO) price surged 23% within 24 hours, mainly driven by Google’s quantum AI whitepaper, with Algorand cited multiple times. The 24-hour trading volume jumped 429%, drawing institutional investors’ attention. The ALGO price rebounded to $0.1052, still below its all-time high, so the market needs to closely watch the subsequent trend.
GateNews18m ago
CryptoQuant: Bitcoin derivatives market dominated by short positions, and the positioning index falls to -3.1
In recent weeks, the Bitcoin derivatives market has been dominated by shorts. The positioning index has continued to fall, and the price has dropped from $73,925 to $66,603. Long positions are facing strong liquidation pressure; the market lacks reversal support, and there is downside risk.
GateNews1h ago
Trump’s Threats Escalate Against Iran: Bitcoin Falls Below a Key Threshold as $65,000 Becomes a Make-or-Break Line
In April 2026, Trump admitted that strikes had been launched against Iranian infrastructure, causing market sentiment to weaken and pulling the price of Bitcoin back to $66,300. Rising geopolitical risk caused financial markets to diverge; Asian stocks rebounded, while crypto assets came under pressure. If the situation deteriorates, Bitcoin’s support level at $65,000 would trigger technical selling. Market drivers shifted toward geopolitics, and in the short term Bitcoin is unlikely to shake off the impact of macro shocks.
GateNews1h ago
Behind the rebound in Asian stock markets: a surge in mining stocks, pressure on platform stocks, and an intensifying split in capital flows in the crypto market
With expectations of a easing in the Middle East situation, Asian stock markets moved higher across the board, and falling oil prices eased market tensions. Despite pressure on crypto-related stocks on trading platforms, Bitcoin mining stocks performed strongly, indicating a trend of capital being reallocated. The market remains cautious about geopolitical developments and the outlook will be shaped by multiple factors.
GateNews1h ago
Aave V4 Major Upgrade Yet Falls Below $95: Is DeFi Good News Failing or Has Market Pricing Logic Changed?
DeFi lending protocol Aave, after launching its V4 upgrade in 2026, despite significant technical optimizations, saw the token price fall to a 52-week low point, reflecting the market’s focus on macro liquidity and risk appetite. While Aave’s V4 upgrade strengthens its position as core infrastructure, it is difficult in the short term to translate into demand for the token, showing a disconnect between the price and the protocol’s evolution.
GateNews1h ago
