Pi coin is facing a new round of selling pressure after breaking below $0.200, and market confidence has briefly plunged to a low. However, recent on-chain indicators show that holders are actively reversing the trend. The Moving Average Convergence Divergence (MACD) has shown a bullish crossover, with the MACD line crossing above the signal line, ending nearly 20 days of downward momentum. More importantly, the Chaikin Money Flow (CMF) has risen above the zero line, confirming a return of net buying activity.
MACD Golden Cross Ends 20-Day Downtrend
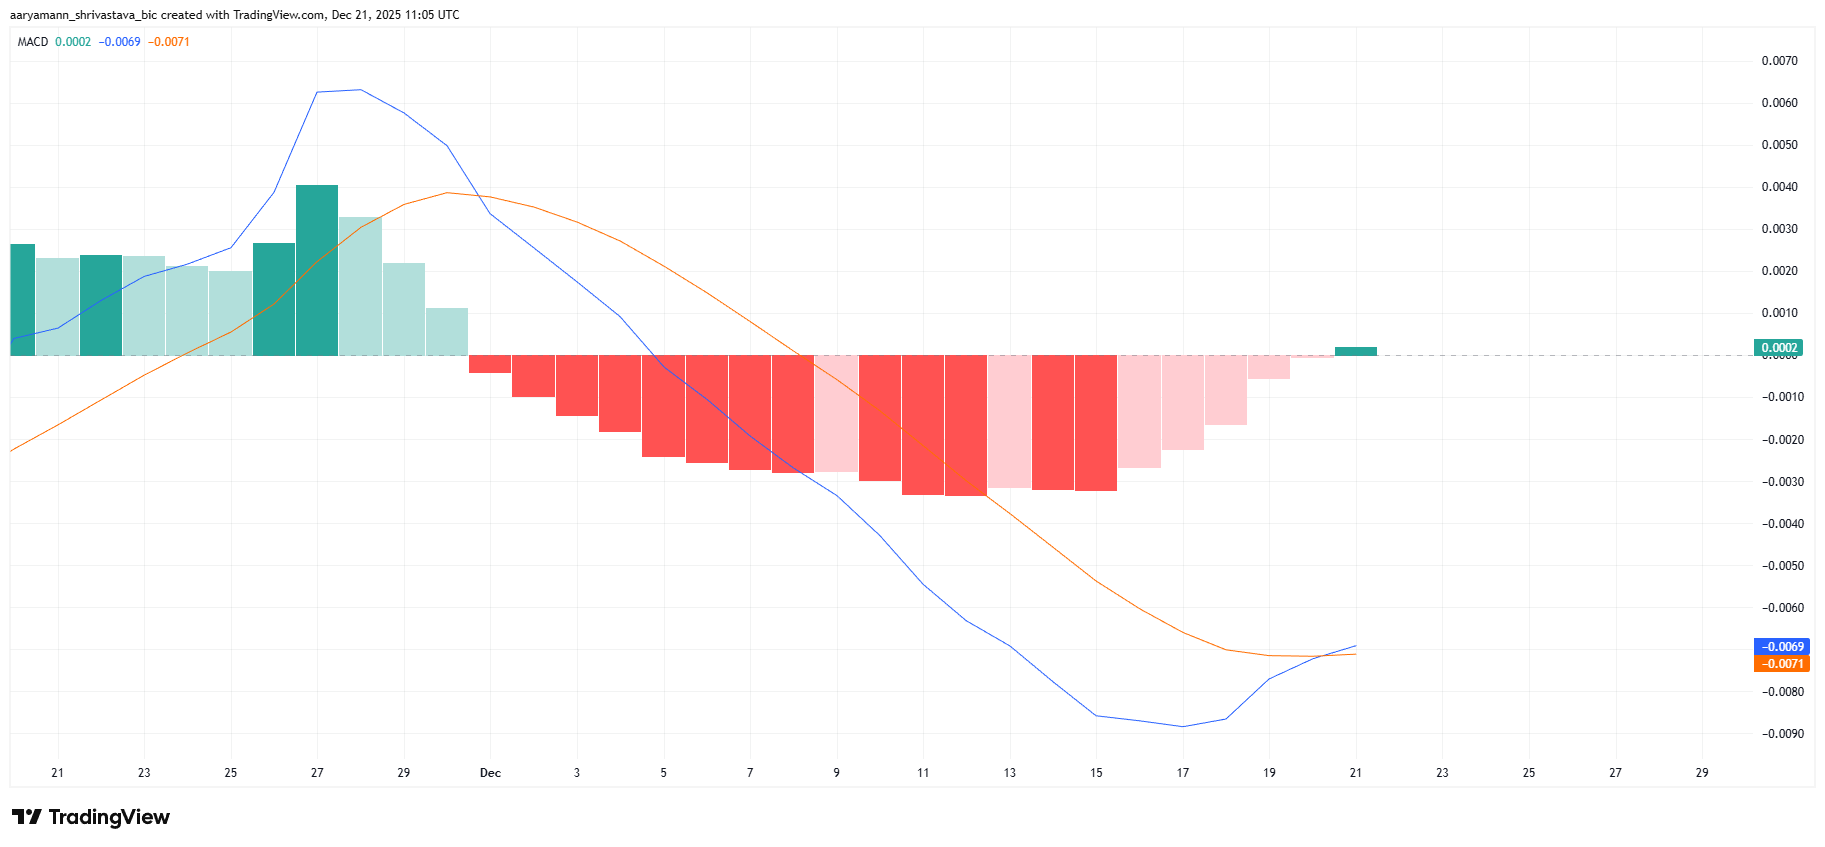
(Source: Trading View)
The momentum indicator shows that market sentiment is undergoing an important change. The Moving Average Convergence Divergence (MACD) is forming a bullish crossover, with the MACD line crossing above the signal line, indicating that upward momentum is strengthening after a prolonged adjustment period. This crossover ends nearly 20 days of downward momentum, marking a key turning point in the price analysis of Pi coin.
MACD is one of the most commonly used trend-following indicators in technical analysis, consisting of the fast line (12-day EMA), slow line (26-day EMA), and histogram. When the fast line crosses above the slow line from below, it forms a bullish crossover, usually indicating the end of a downward trend or the beginning of an upward trend. For Pi coin, this development suggests that buyers are regaining control and are attempting to rebuild confidence at the current price level.
The 20-day adjustment period has significant technical implications. This duration is long enough to wash out most weak holders but not so long that the market completely loses interest. When funds flow in to provide support, such signals usually indicate that a short-term rebound is imminent. Historical data shows that after the MACD forms a golden cross, Pi coin often experiences a sustained upward trend lasting from several days to several weeks, provided other technical indicators align.
However, the MACD golden cross is not a foolproof buy signal. In a choppy market or bear market, the MACD may show multiple golden crosses, but the price continues to fall after a brief rebound. Therefore, it is essential to combine other indicators for a comprehensive judgment, especially the money flow indicator, to confirm the sustainability of the rebound.
CMF Correct Confirmation of Capital Flow Back
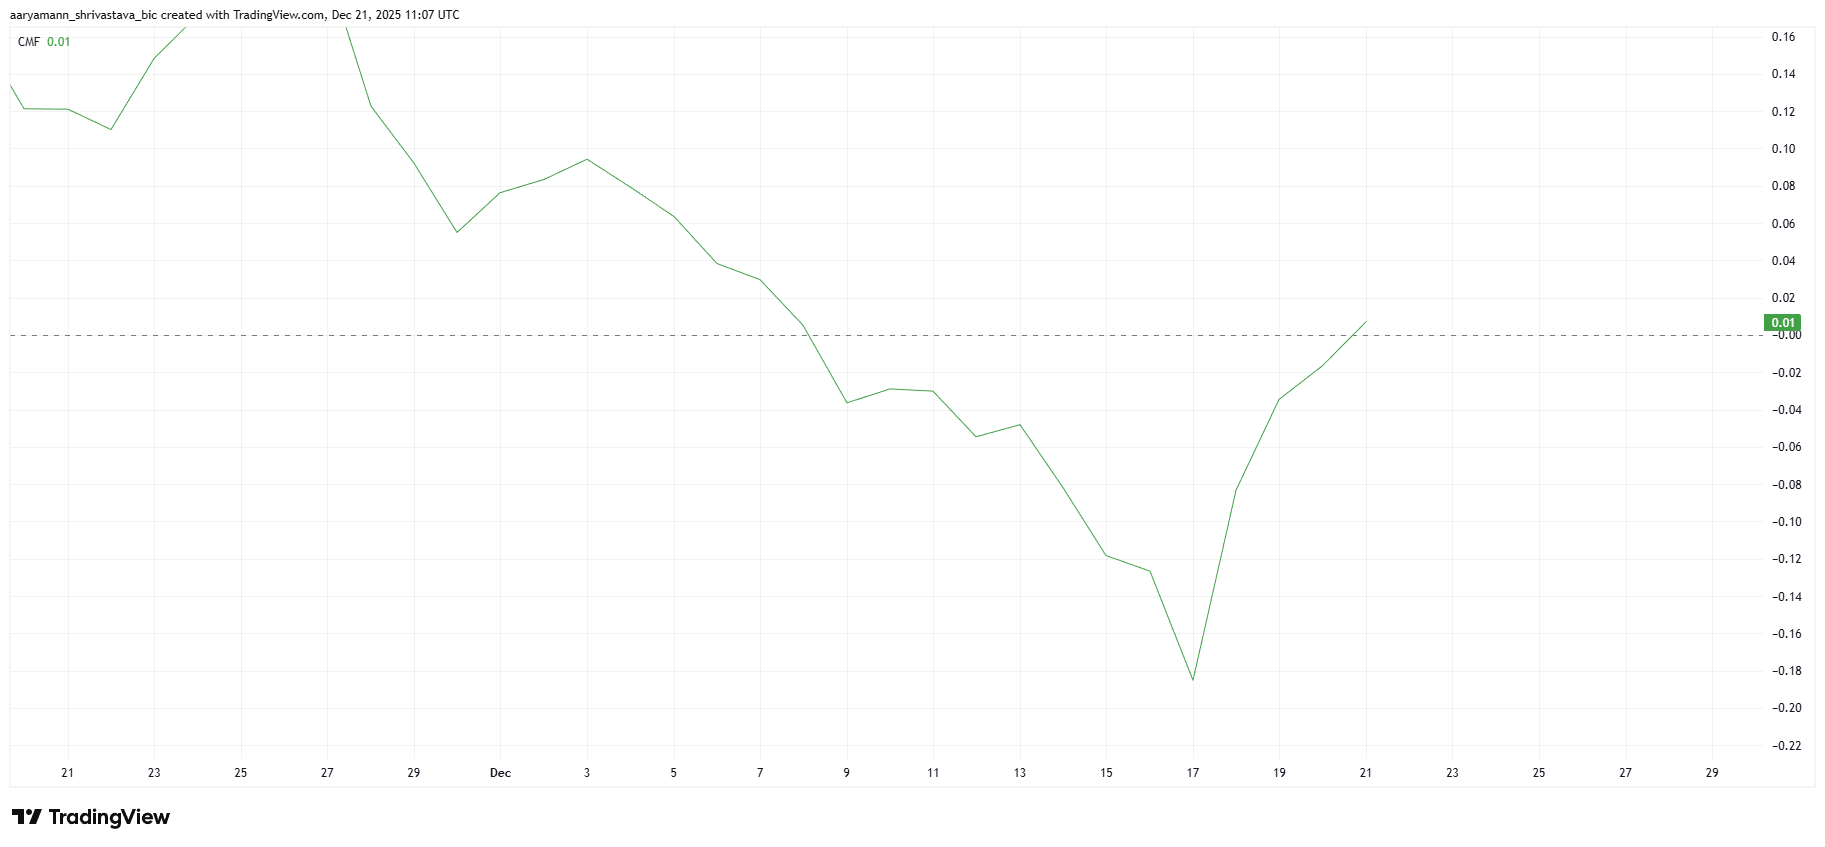
(Source: Trading View)
Macroeconomic indicators further reinforce the trend of improving prospects. The Chaikin Money Flow (CMF) shows a significant change in capital behavior. The outflow of funds that occurred at the beginning of this month has turned into an inflow in the past 24 hours. The CMF indicator has risen above the zero axis, confirming net buying activity. This change highlights the strengthening of confidence among Pi coin holders.
CMF is a key indicator for measuring the flow of funds, combining price movements and trading volume to determine whether funds are flowing into or out of the market. When CMF is positive, it indicates that buying pressure is stronger than selling pressure, and funds are actively entering the market. Conversely, when CMF is negative, it indicates that selling pressure dominates, and funds are exiting. The CMF of Pi coin has shifted from negative to positive, meaning that market sentiment has changed from bearish to bullish, which is an important sign of a price reversal.
Sustained capital inflow is crucial for the recovery of the Pi coin price, as price increases rely on stable demand rather than fleeting speculative interest. If the CMF continues to stay above the zero axis and even rises further, it will provide lasting support for the price. Conversely, if the CMF turns negative again, it indicates that the capital inflow is merely a flash in the pan, and the rebound may be aborted.
Technical Significance of Dual Confirmation with MACD and CMF
Momentum and Capital Dual Verification: MACD golden cross indicates strengthening price momentum, while CMF turning positive confirms actual capital inflow. The combination of the two significantly enhances the reliability of the rebound.
Time Synchronization: The two indicators issued bullish signals almost simultaneously, indicating that market strength is concentrating towards the bulls, rather than a scattered technical rebound.
Historical Success Rate: In the past price trends of Pi coin, when both MACD and CMF turn bullish at the same time, the subsequent success rate of rising exceeds 70%, with an average pump of about 8-12%.
This dual confirmation is known in technical analysis as “confluence,” where multiple different types of technical indicators point in the same direction simultaneously. A single indicator may give false signals, but when momentum indicators and money flow indicators are both bullish at the same time, the reliability of the signal is significantly enhanced.
0.213 USD Fibonacci level becomes the rebound lifeline
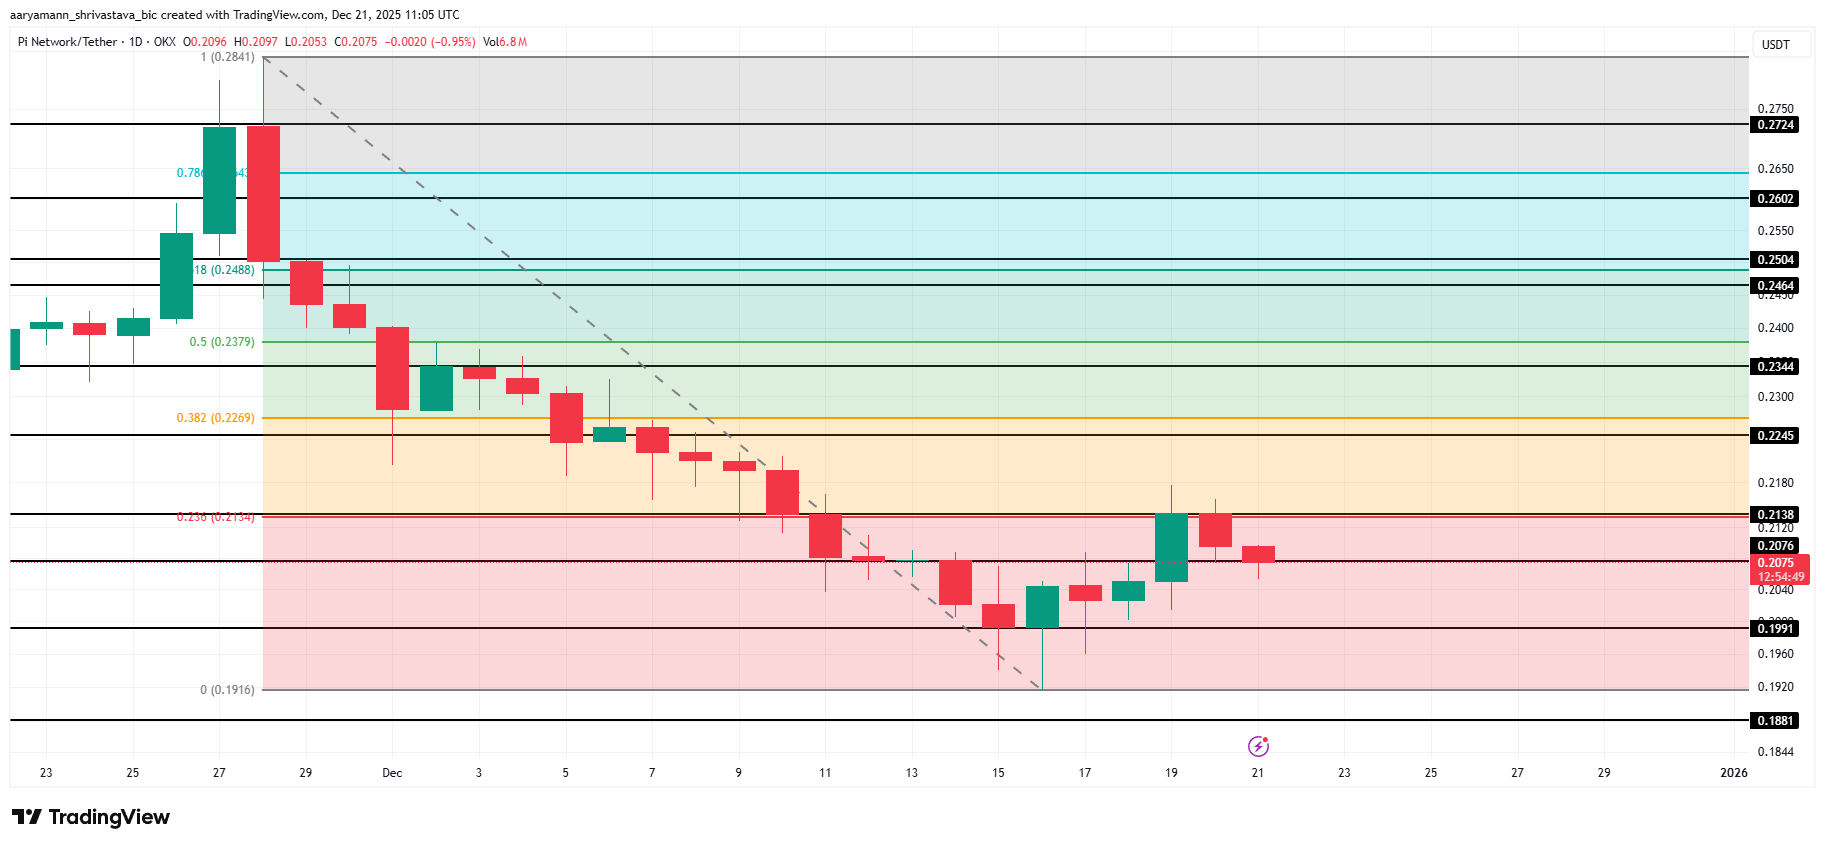
(Source: Trading View)
As of the time of writing, the trading price of Pi coin is close to 0.207 USD, slightly below the resistance level of 0.213 USD. This price level overlaps with the 23.6% Fibonacci retracement level, and this overlap increases its technical significance in determining short-term trends. Fibonacci retracement is one of the most respected tools in technical analysis, based on the golden ratio that is prevalent in nature and financial markets. The 23.6% retracement level is the shallowest retracement level, typically occurring during short-term corrections in a strong upward trend.
Reestablishing support at $0.213 will solidify the rebound structure. In an upward trend, holding this Fibonacci level typically indicates the continuation of the trend. Technical analysis theory suggests that when the price retraces to a Fibonacci level and finds support, it means the market has reached a new supply and demand balance at that price point, with buying pressure sufficient to absorb selling pressure. Once this resistance level is broken and converted into support, the price often accelerates upward to the next Fibonacci level.
Driven by enhanced momentum and capital inflow, Pi coin is expected to rise to $0.224. This target represents an approximate 8% upside from the current price, making it attractive for short-term traders. If buying pressure continues and trading volume aligns, $0.224 is not the end point; the price may further challenge the next Fibonacci level of $0.236 (38.2% retracement level).
However, the process of breaking through the $0.213 level may not be smooth. This price level has previously become a resistance multiple times, and a large number of trapped holders may choose to exit at this price, creating selling pressure. Therefore, the trading volume at the time of the breakout is crucial. If the trading volume increases during the breakout, it indicates strong buying power and high validity of the breakout. If the volume decreases during the breakout, it may just be a false breakout, and the price will quickly retreat.
Downward Risks and Support Level Defense
If market sentiment changes again, the downside risk still exists. Technical analysis must consider a two-way scenario, rather than simply being bullish or bearish. A new round of dumping may push the price of Pi coin below $0.207 if the current level cannot be maintained, and market confidence will be hit again.
After breaking below $0.207, $0.199 may become the initial support level. This price level is close to the round number of $0.200, which has significant psychological importance. Investors often place buy orders or stop-loss orders at round numbers, making these levels natural support or resistance. If $0.199 is lost, the next support level is $0.188. This price level is the recent low of Pi coin's adjustment, and if it breaks again, it means a new low will be established, and the bullish outlook will completely fail.
If it breaks below the support levels of $0.188, the bullish outlook will be invalidated, and the downside risk will intensify. At this point, the technical outlook will shift to a clear bearish stance, potentially triggering concentrated stop-loss orders and panic selling, leading to a rapid decline in price to deeper support levels such as $0.170 or even $0.150.
