Date: Fri, Dec 19 2025 | 12:45 PM GMT
The broader cryptocurrency market is showing relative strength despite concerns around the Japan rate hike. Cooling U.S. inflation has helped both Bitcoin (BTC) and Ethereum (ETH) hold in the green, and this stability is beginning to spill over into select altcoins, including Stellar (XLM).
XLM has posted modest gains today, but beyond the short-term price move, the daily chart is starting to reveal an emerging technical structure that could set the stage for a more meaningful recovery if key levels continue to hold.
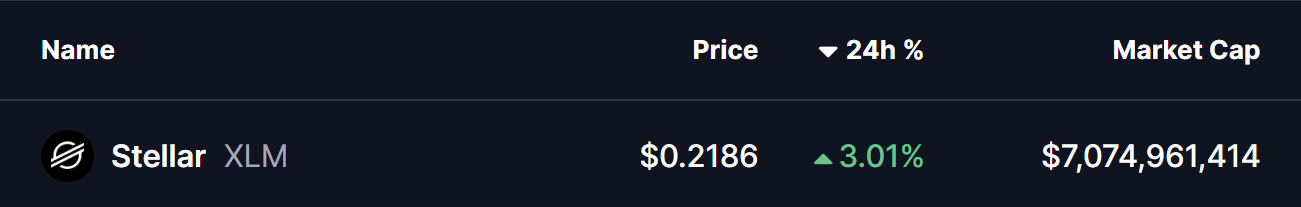
Source: Coinmarketcap
Harmonic Pattern Signals Potential Upside
On the daily timeframe, XLM appears to be forming a Bearish Cypher harmonic pattern — a setup that often generates upside momentum during its final CD leg before price reaches the Potential Reversal Zone (PRZ).
The pattern began at point X near the $0.3113 region, where XLM topped out before entering a sharp corrective phase. Price then declined into point A, followed by a rebound toward point B. From there, XLM rolled over again and extended lower into point C around the $0.2029 area, completing the core structure of the pattern.
Since tagging this low, XLM has started to stabilize and grind higher, currently trading near the $0.2188 level. This slow but steady recovery suggests that selling pressure may be fading, with buyers beginning to defend the recent lows more aggressively.
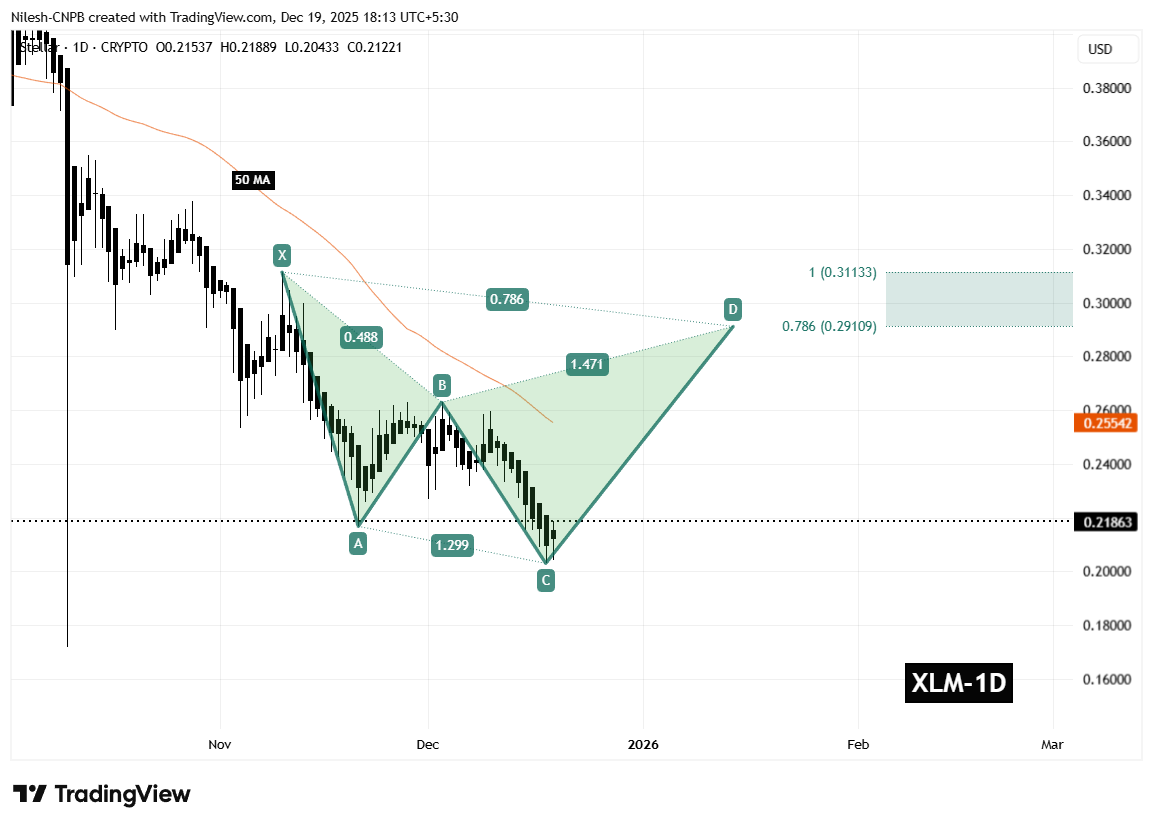
Stellar (XLM) Daily Chart /Coinsprobe (Source: Tradingview)
A key technical factor aligning with this structure is the 50-day moving average, currently positioned near $0.2554. This moving average has consistently acted as dynamic resistance throughout the downtrend and represents an important hurdle for bulls to overcome in the near term.
What’s Next for XLM?
In the short term, the most critical level to monitor is the C-leg support around $0.2029. As long as XLM holds above this zone, the harmonic pattern remains valid and the bullish CD-leg scenario stays intact.
If price continues to build strength from this base, the next major test will be a reclaim of the 50-day moving average near $0.2554. A decisive break and close above this level would signal improving momentum and could accelerate upside continuation.
Based on the harmonic structure, the projected upside targets sit within the Potential Reversal Zone, defined between the 0.786 Fibonacci extension near $0.2910 and the 1.0 extension around $0.3113. Reaching this zone would represent a potential upside of roughly 40–45% from current price levels, making it a key area where profit-taking or stronger resistance could emerge.
On the downside, failure to hold above the $0.2029 support would significantly weaken the bullish setup. A breakdown below this level could invalidate the harmonic structure and expose XLM to deeper downside pressure before any sustainable recovery attempt develops.
For now, the chart suggests Stellar is sitting at an important technical crossroads. While confirmation is still needed, the presence of a well-defined harmonic pattern indicates that a short- to medium-term bounce remains a realistic possibility if buyers continue to defend current levels and reclaim key resistance zones.
Disclaimer: The views and analysis presented in this article are for informational purposes only and reflect the author’s perspective, not financial advice. Technical patterns and indicators discussed are subject to market volatility and may or may not yield the anticipated results. Investors are advised to exercise caution, conduct independent research, and make decisions aligned with their individual risk tolerance.
Disclaimer: The information on this page may come from third parties and does not represent the views or opinions of Gate. The content displayed on this page is for reference only and does not constitute any financial, investment, or legal advice. Gate does not guarantee the accuracy or completeness of the information and shall not be liable for any losses arising from the use of this information. Virtual asset investments carry high risks and are subject to significant price volatility. You may lose all of your invested principal. Please fully understand the relevant risks and make prudent decisions based on your own financial situation and risk tolerance. For details, please refer to
Disclaimer.
Related Articles
Dogecoin Near Key Breakout Zone as X Money Buzz Builds
Key Insights:
Dogecoin volatility has tightened significantly, with Bollinger Bands compressing to yearly lows, indicating a sharp price move could emerge within days.
Rising futures volume and strong long positioning show traders anticipate upside, although repeated liquidations highlight r
CryptoFrontNews6m ago
Bitcoin Transaction Fees Hit Lowest Level Since 2017: But It’s Not Due to Weak Demand
The average transaction fee on the Bitcoin network has fallen below $0.40 for the first time since 2017, according to on-chain data shared by analyst Darkfost.
The drop is markedly different from other times in the past when low costs were triggered by low usage, as it has come while daily transact
CryptoPotato13m ago
Hyperliquid Volume Surges as HYPE Tests Key Resistance Zone
Key Insights
Hyperliquid reached 5.4 billion dollars in daily volume, driven mainly by commodities, as traders shift toward platforms offering continuous access to markets.
The HYPE price holds above EMA support while testing resistance, with momentum indicators showing gradual strength
CryptoNewsLand37m ago
PEPE Signals Range-Bound Move as Momentum Weakens
PEPE's trading remains cautious with neutral RSI and weak MACD, indicating limited momentum and ongoing selling pressure. Oversold stochastic hints at possible short-term rebounds, but traders await confirmation before entering positions amid mixed signals.
CryptoNewsLand41m ago
SHIB Price Rises on Golden Cross and Growing Market Activity
Key Insights
The Shiba Inu price rose about five percent as an hourly golden cross and higher volume signaled renewed trader participation and short-term momentum strength.
Exchange outflows and rising liquidity suggest accumulation behavior among holders while reinforcing price stability
CryptoNewsLand56m ago
85% or 200% Surge Next for Cardano? ADA Tests Key Level Linked to Historic Breakouts
Cardano’s native token has been among the poorest performers in the past year, with on-chain data suggesting that ADA active wallets are down over 40% on their investments within this timeframe.
However, this could actually be bullish for the underlying asset, especially when it’s combined with ano
CryptoPotato1h ago
