Zcash (ZEC) extended its recovery on Tuesday, rising 10.29% in the past 24 hours to over $425, or 41.50% up from the lows of around $300 just a week ago.
Key takeaways:
- ZEC eyes $500 as double-bottom signals and whale accumulation support the recovery.
- Bear-flag risks persist, with overbought RSI hinting at a possible pullback toward $260–$280.
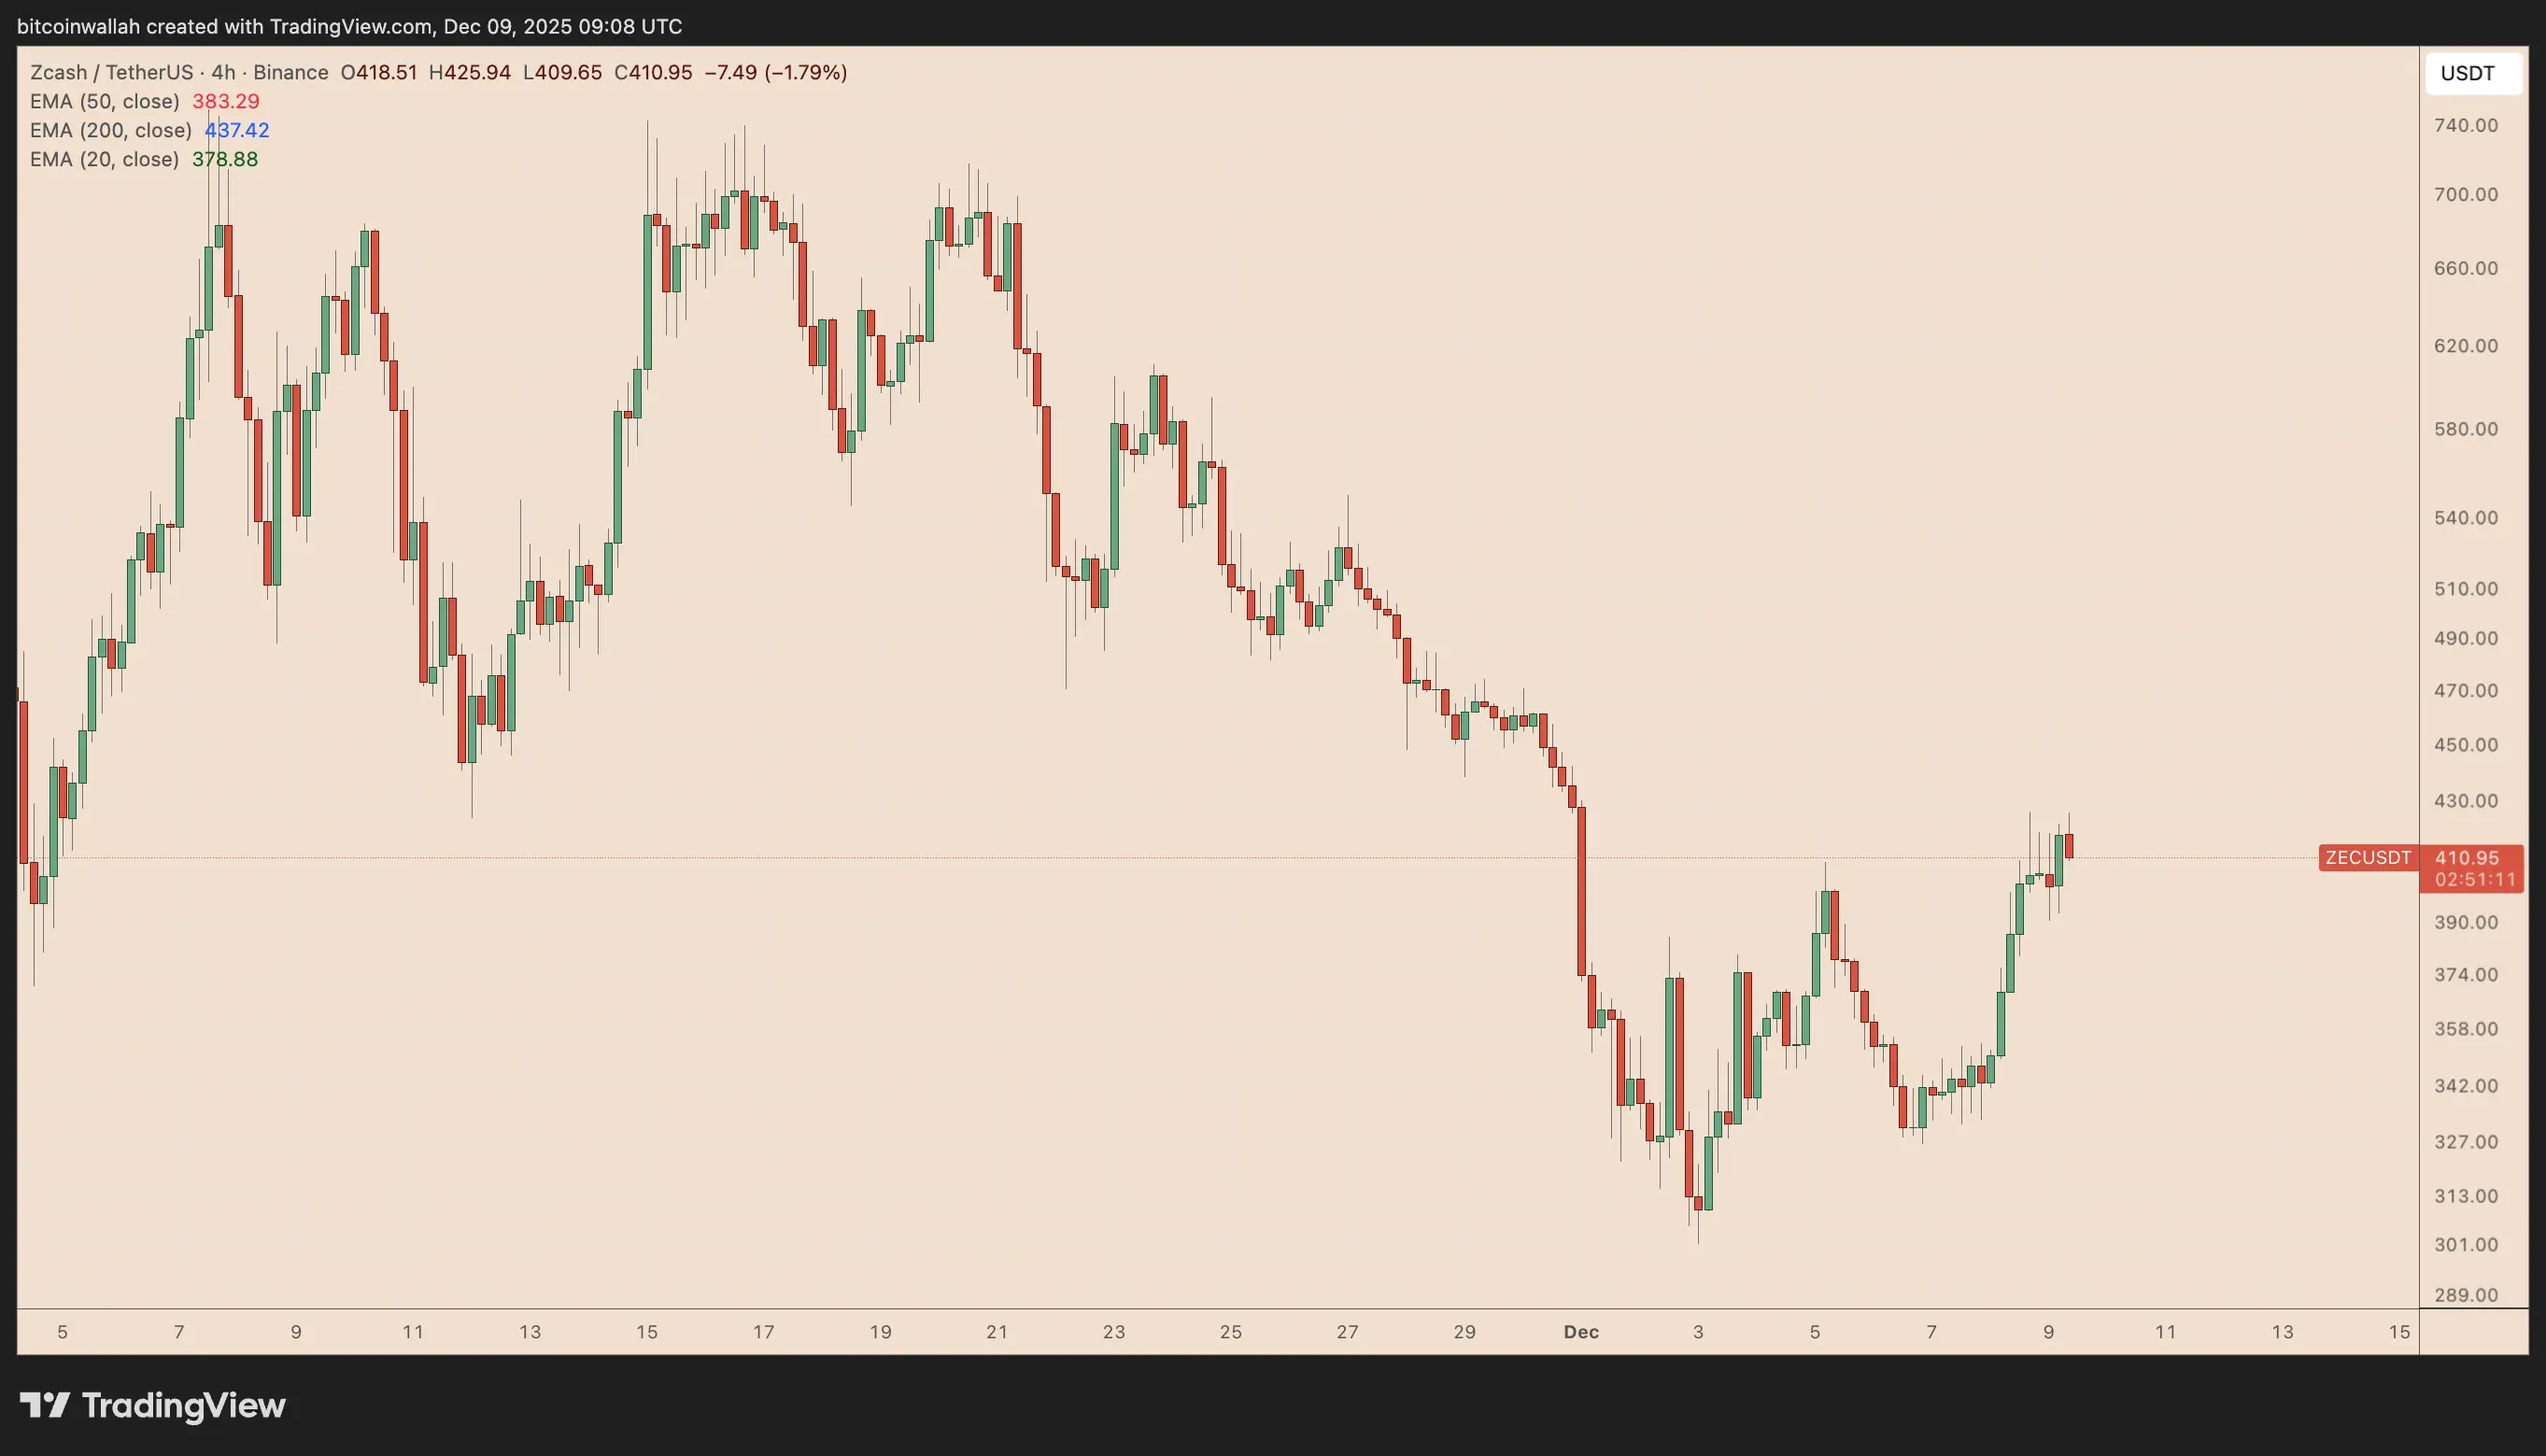 ZEC/USDT four-hour price chart. Source: TradingViewThe sharp rebound prompted some analysts to anticipate a further rally to or above $500 in the coming days.
Can Zcash retest the psychological resistance?
From double bottom to $500 ZEC next?
Trader Goomba identified Zcash’s recent swing lows as a potential double-bottom structure.
The pattern appeared to develop in the $300–$310 region, where ZEC recorded two similar troughs within a short time frame. The subsequent move above the interim resistance near $380 marked what the trader described as a neckline breakout.
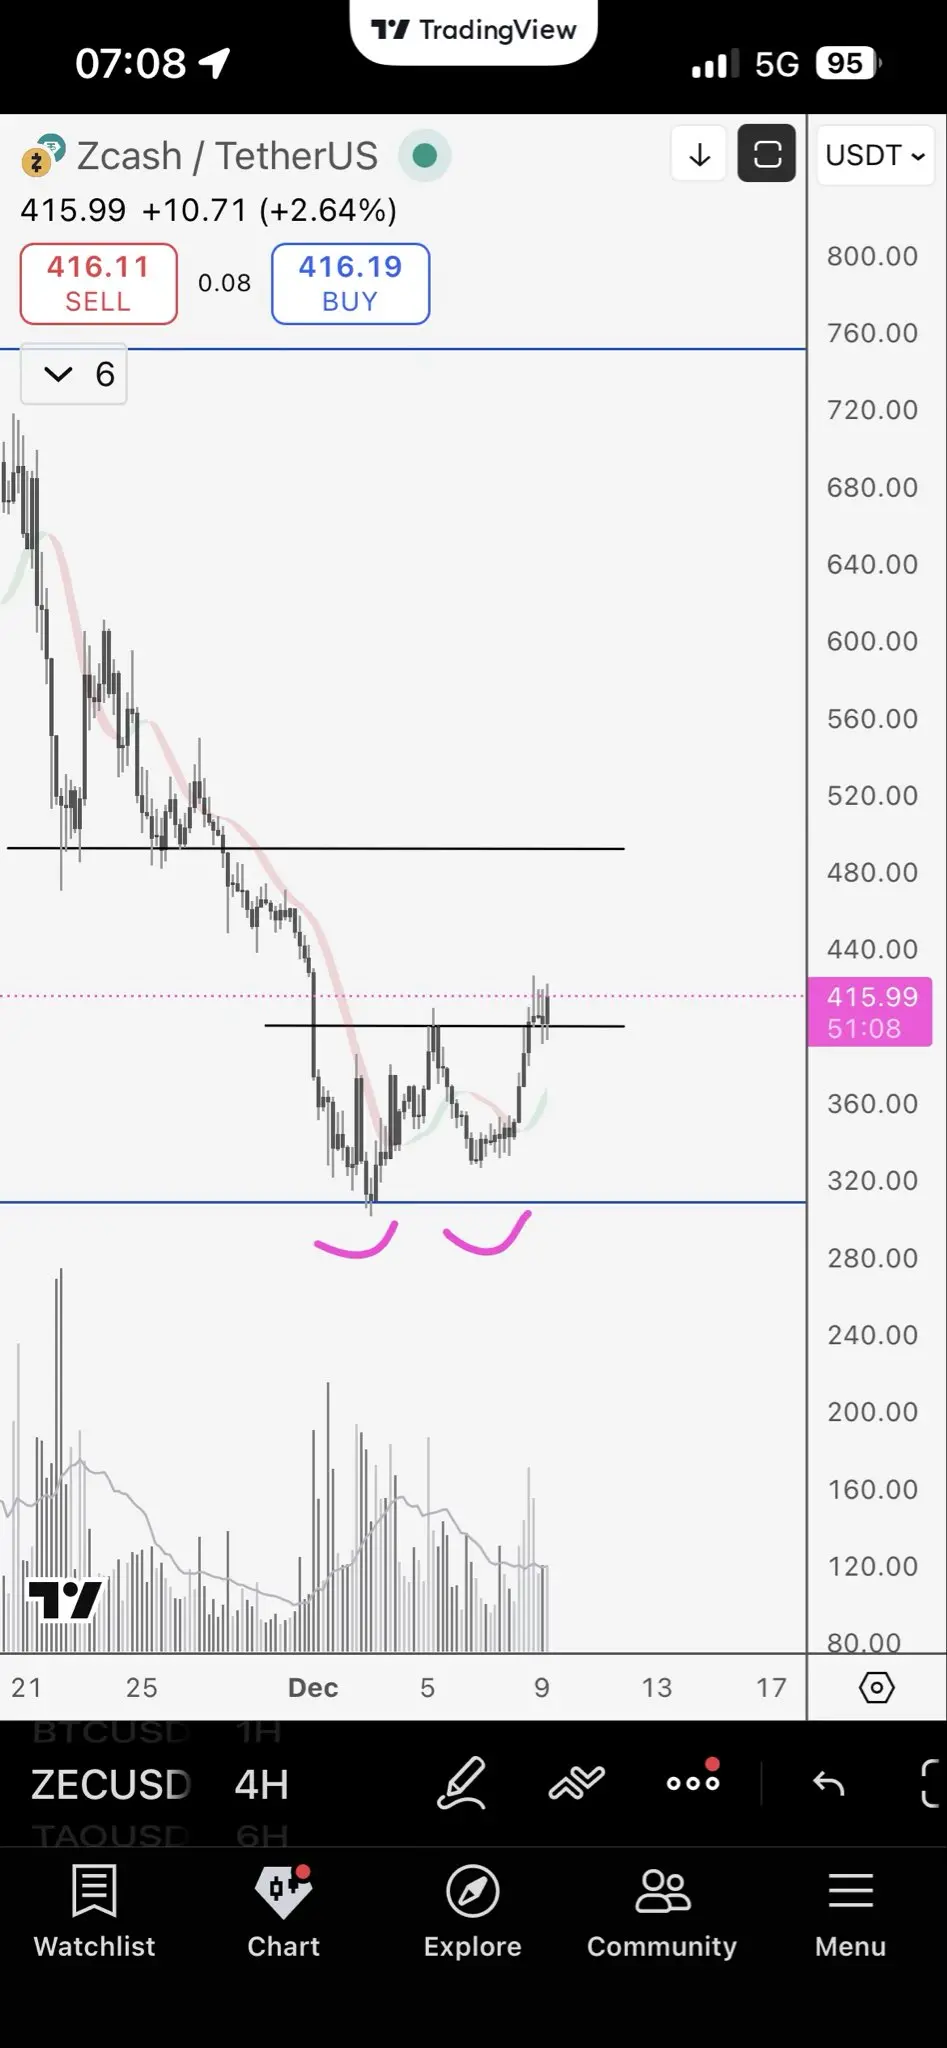 ZEC/USDT daily price chart. Source: TradingView/Goomba Such formations carry a measured objective that places the next notable target in the $480–$500 range, coinciding with a previous supply zone.
Goomba noted that the structure remained valid as long as ZEC held above the reclaimed neckline level.
Zcash whales are absorbing selling pressure
ZEC’s retail holders ($0–$1,000) and mid-sized traders ($1,000–$100,000) cut more than $30 million in net exposure during the latest rebound, according to data highlighted by trader Ardi.
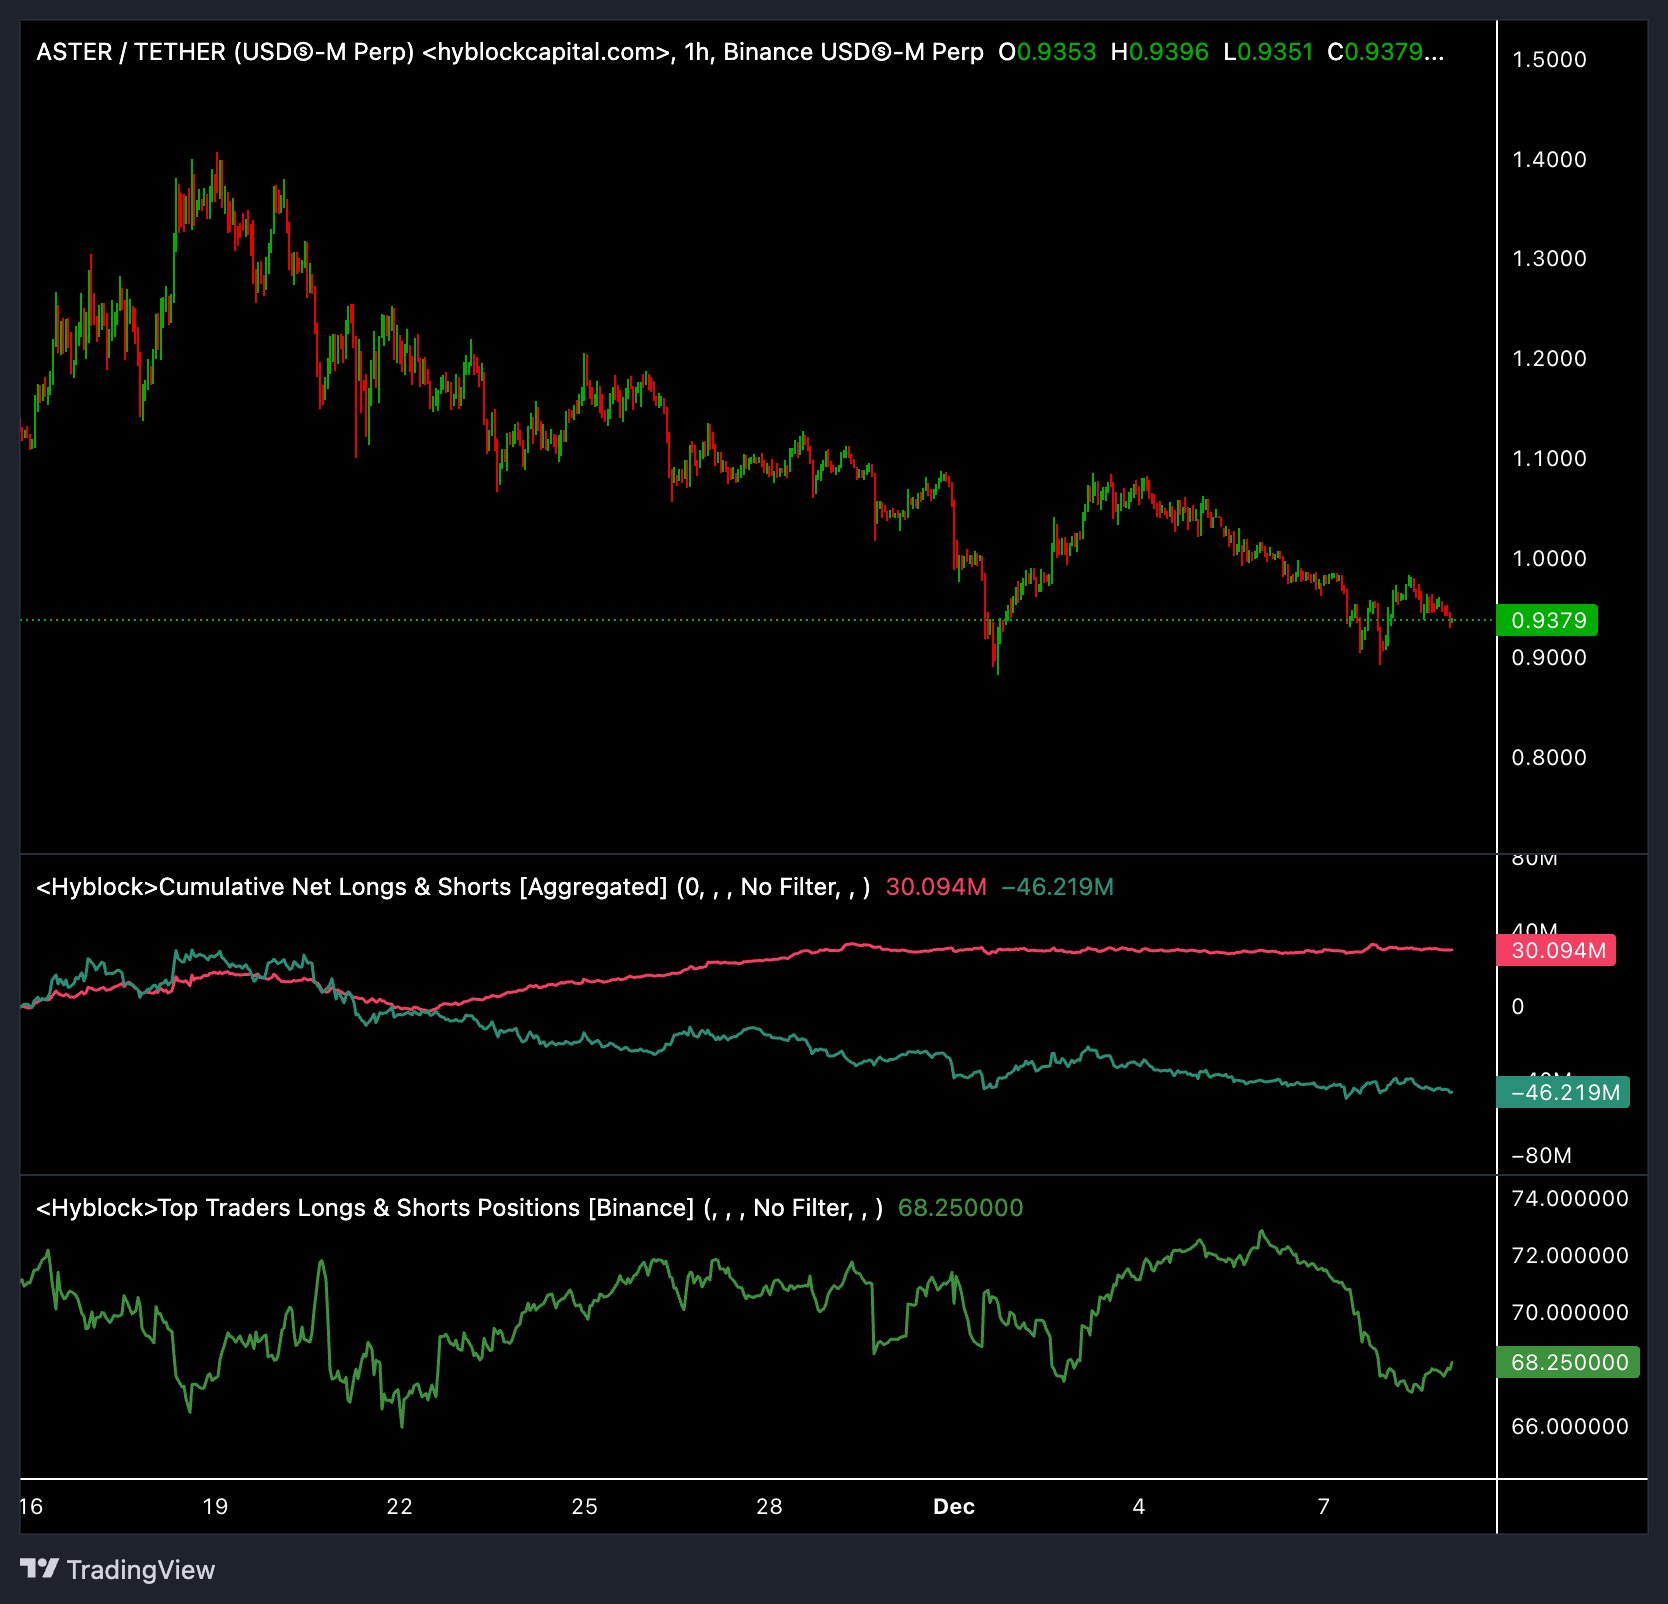 ZEC/USDT hourly chart. Source: TradingView/ArdiIn contrast, larger whale accounts ($100,000–$10 million) added over $100 million in the same period, suggesting a divergence in behavior.
Simply put, smaller participants appeared to sell into the rally while higher-capital accounts increased their exposure.
Related: What’s behind the surge in privacy tokens as the rest of the market weakens?
That raises ZEC’s potential to continue its rebound toward the $500 level, given that the larger investors are looking forward to higher prices.
Bear flag may spoil party for ZEC bulls
Zcash’s latest rebound unfolded inside what still appeared to be a classic bear flag pattern, a weakening relief channel that formed after a steep November sell-off.
Historically, these rising channels resolved to the downside, and ZEC’s failure to hold above the flag’s upper trendline suggested that sellers were already regaining control as of Tuesday.
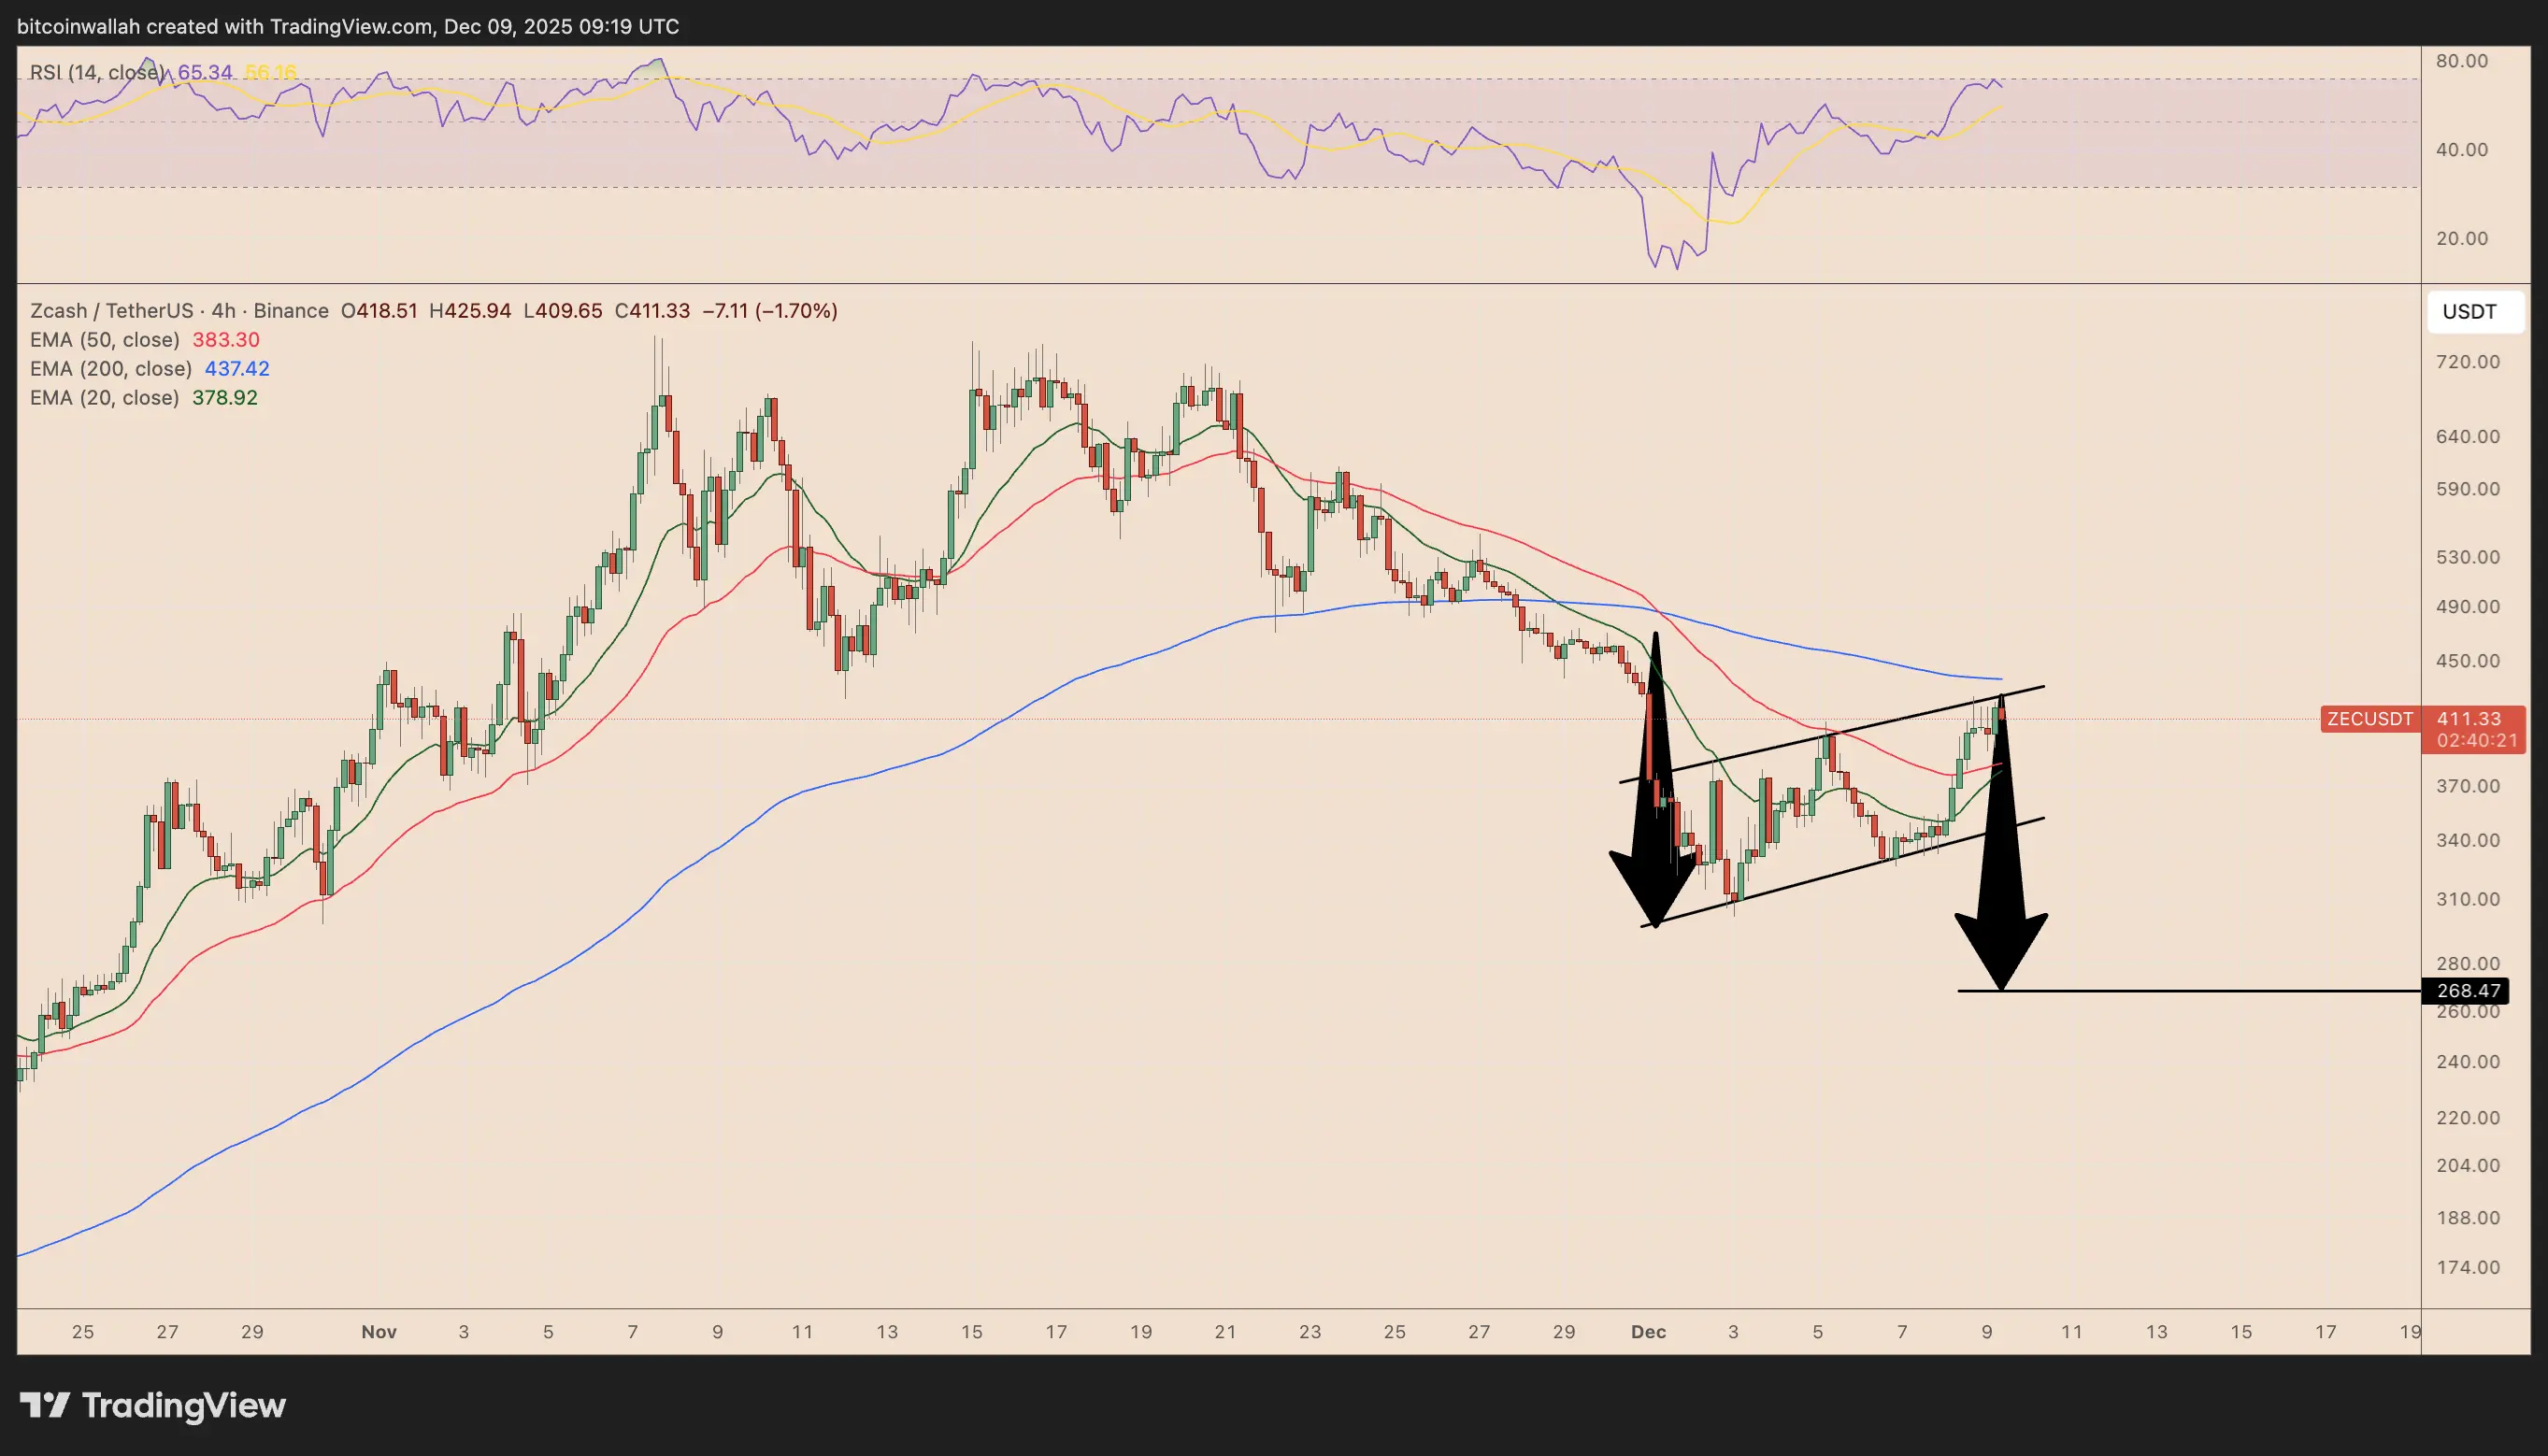 ZEC/USDT four-hour price chart. Source: TradingViewPrice also struggled to break above the 200-day exponential moving average (200-4H EMA; the blue wave), reinforcing the bearish continuation setup.
At the same time, ZEC’s relative strength index (RSI) had pushed above the overbought threshold of 70, a region where upside momentum often fades.
Together, these signals suggested that a breakdown from the flag could have opened the door to a move toward the $260–$280 zone, which is approximately 35% below current price levels.
This article does not contain investment advice or recommendations. Every investment and trading move involves risk, and readers should conduct their own research when making a decision.
This article does not contain investment advice or recommendations. Every investment and trading move involves risk, and readers should conduct their own research when making a decision. While we strive to provide accurate and timely information, Cointelegraph does not guarantee the accuracy, completeness, or reliability of any information in this article. This article may contain forward-looking statements that are subject to risks and uncertainties. Cointelegraph will not be liable for any loss or damage arising from your reliance on this information.
- #Altcoins
- #Privacy
- #Markets
- #Zcash
- #Market Analysis
- #Altcoin Watch
Add reaction
![]()
Disclaimer: The information on this page may come from third parties and does not represent the views or opinions of Gate. The content displayed on this page is for reference only and does not constitute any financial, investment, or legal advice. Gate does not guarantee the accuracy or completeness of the information and shall not be liable for any losses arising from the use of this information. Virtual asset investments carry high risks and are subject to significant price volatility. You may lose all of your invested principal. Please fully understand the relevant risks and make prudent decisions based on your own financial situation and risk tolerance. For details, please refer to
Disclaimer.
Related Articles
Solana DEX trading volume falls to its lowest level since September 2024, as SOL tests the $80 support level
Solana token SOL has recently fallen by about 11%, repeatedly testing the $80 support level as the market worries it could retrace to $75. Despite network fees continuing to decline, Solana remains appealing for ecosystem development, with DApp revenue surpassing Ethereum. Overall market performance is poor, but SOL continues to face pressure.
GateNews11m ago
Solana DEX trading volume drops to a new low—can SOL hold the $80 support level?
The Solana network faces pressure from declining DEX trading volume and SOL’s token price falling to $82.98, as it moves toward the $80 support level. Although trading volume dropped to $55.5 billion in March, Solana performs exceptionally well in the high-revenue DApp space, which still helps stabilize the price. Despite the challenges, analysts remain optimistic about SOL’s long-term outlook and believe that a short-term pullback does not necessarily mean the price will break below $75.
GateNews19m ago
Bitcoin (BTC) Stuck in a ‘No Trade Zone:’ When Is the Next Big Move Coming?
The primary cryptocurrency has experienced significant volatility lately, mainly due to the geopolitical tension caused by the war in the Middle East.
One popular analyst described the current price area as a “no-trade zone,” arguing that a clear move in either direction will depend on how BTC
CryptoPotato37m ago
Why is Bitcoin up today? Trump’s move to withdraw from Iran within 2 to 3 weeks sparks a rebound
U.S. President Trump announced that he would withdraw from Iran within 2 to 3 weeks, prompting a short-term bounce in Bitcoin and a rebound in market risk appetite. However, Bitcoin faces the risk of falling for the sixth consecutive month; if this month’s close is below $67,300, it would further confirm downward pressure. Analysts noted that there are three possible market scenarios ahead, and it is necessary to closely watch how the outlook develops.
MarketWhisper37m ago
Bitcoin, stocks soar as markets respond to chance of US and Israel-Iran war ending
Bitcoin (BTC) briefly jumped to $68,589, and US stock markets rallied as investors reacted to US President Donald Trump's statements on considering options for ending the US and Israel-Iran war. Separate, unconfirmed comments attributed to Iranian President Masoud Pezeshkian also suggested that Iran
Cointelegraph41m ago
